Once an application is running in an Environment, you can select it to get complete visibility and manage any of its components.
From the main application view you can drill-down into components, and even individual containers.
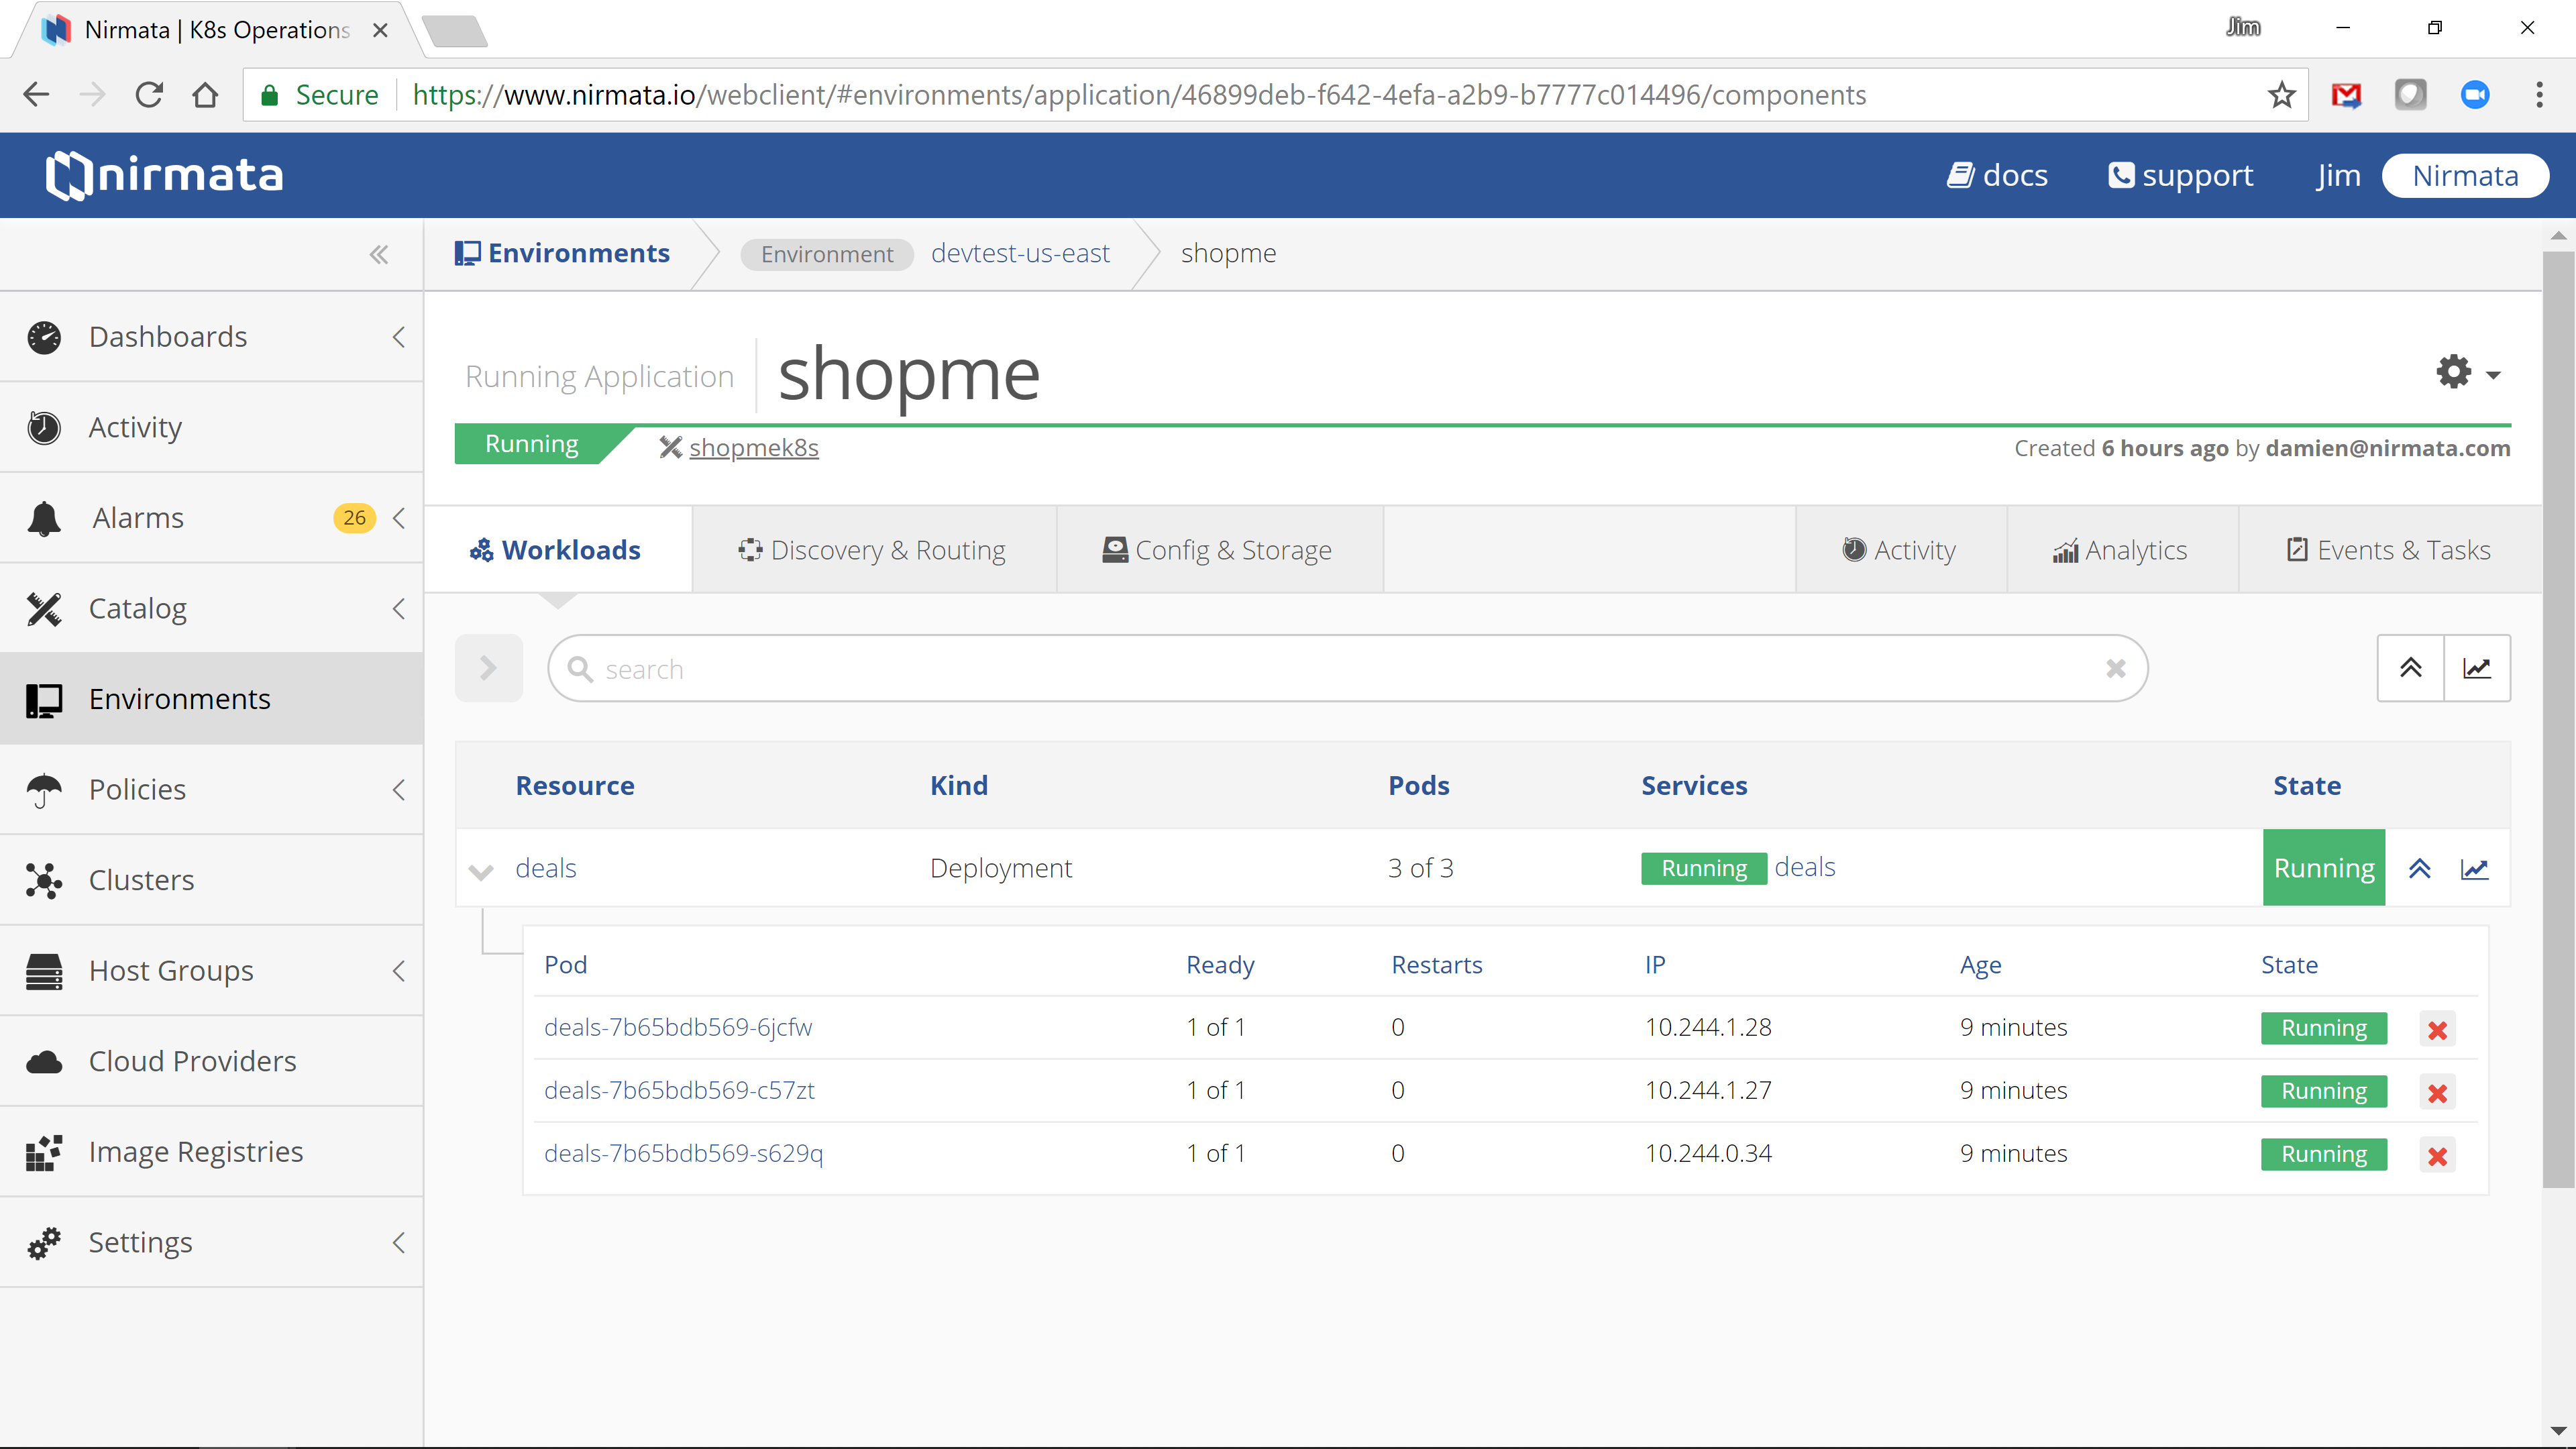
Viewing Application Resources
To view the status for an application resource (component), navigate to the Environment and then select the component.
Quickly navigate between Resource, Service, Pod, Container Template, and Running Container from within each view.
Resource View
Each component view provides access to Deployment Status, Deployment Spec, Pod Template, and Related Resources. Click on any link within a category to quickly navigate to the detail page.
From the Related Resources panel, view Services, Persistent Volume Claims, and Horizontal Pod Autoscalers.
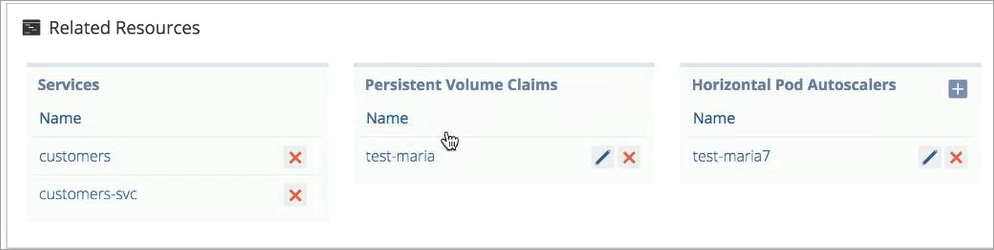
Click on the links within the Related Resources panel to perform component-specific actions or to view component-specific service details.
Services:
- Delete a service
- View service details
Persistent Volume Claims (PVC):
- Delete PVC
- Edit PVC
- View PVC details
Horizontal Pod Autoscalers (HPA):
- Add HPA
- Edit HPA
- Delete HPA
- View HPA details
NOTE: HPA is associated with a component by the Target field in the HPA creation form.
Service View
From within the Related Resources panel, click on a service name to view the service metrics and access service-specific Resources.
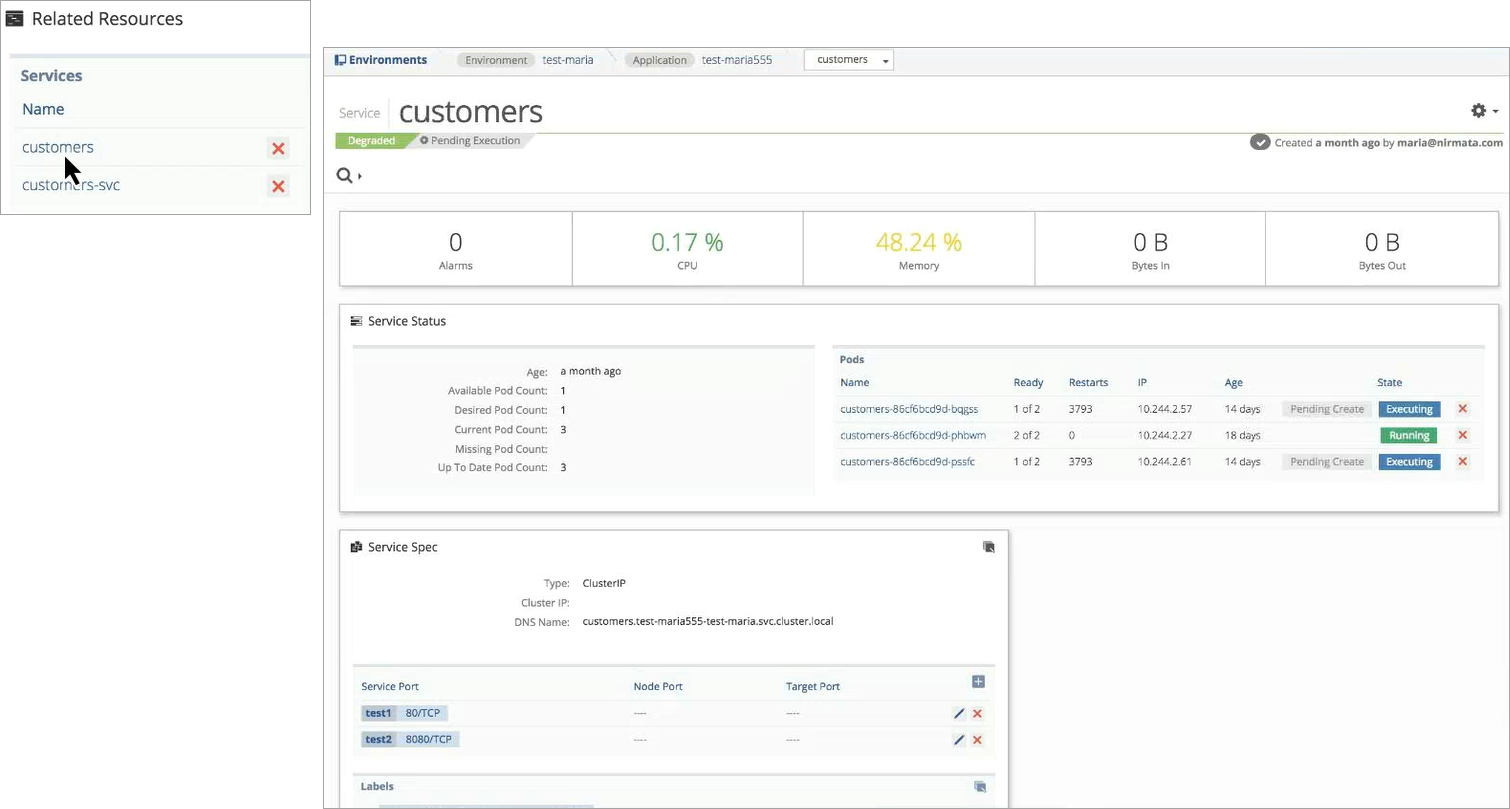
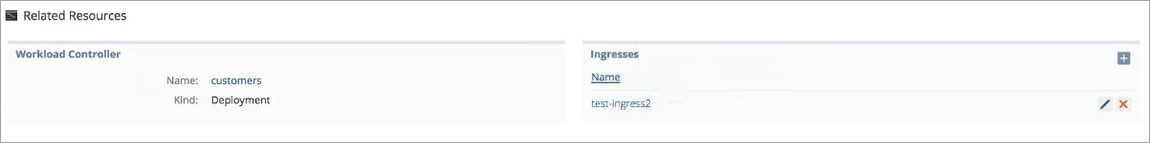
The Related Resources Panel displays the Workload Controller and Ingresses for the specified service.
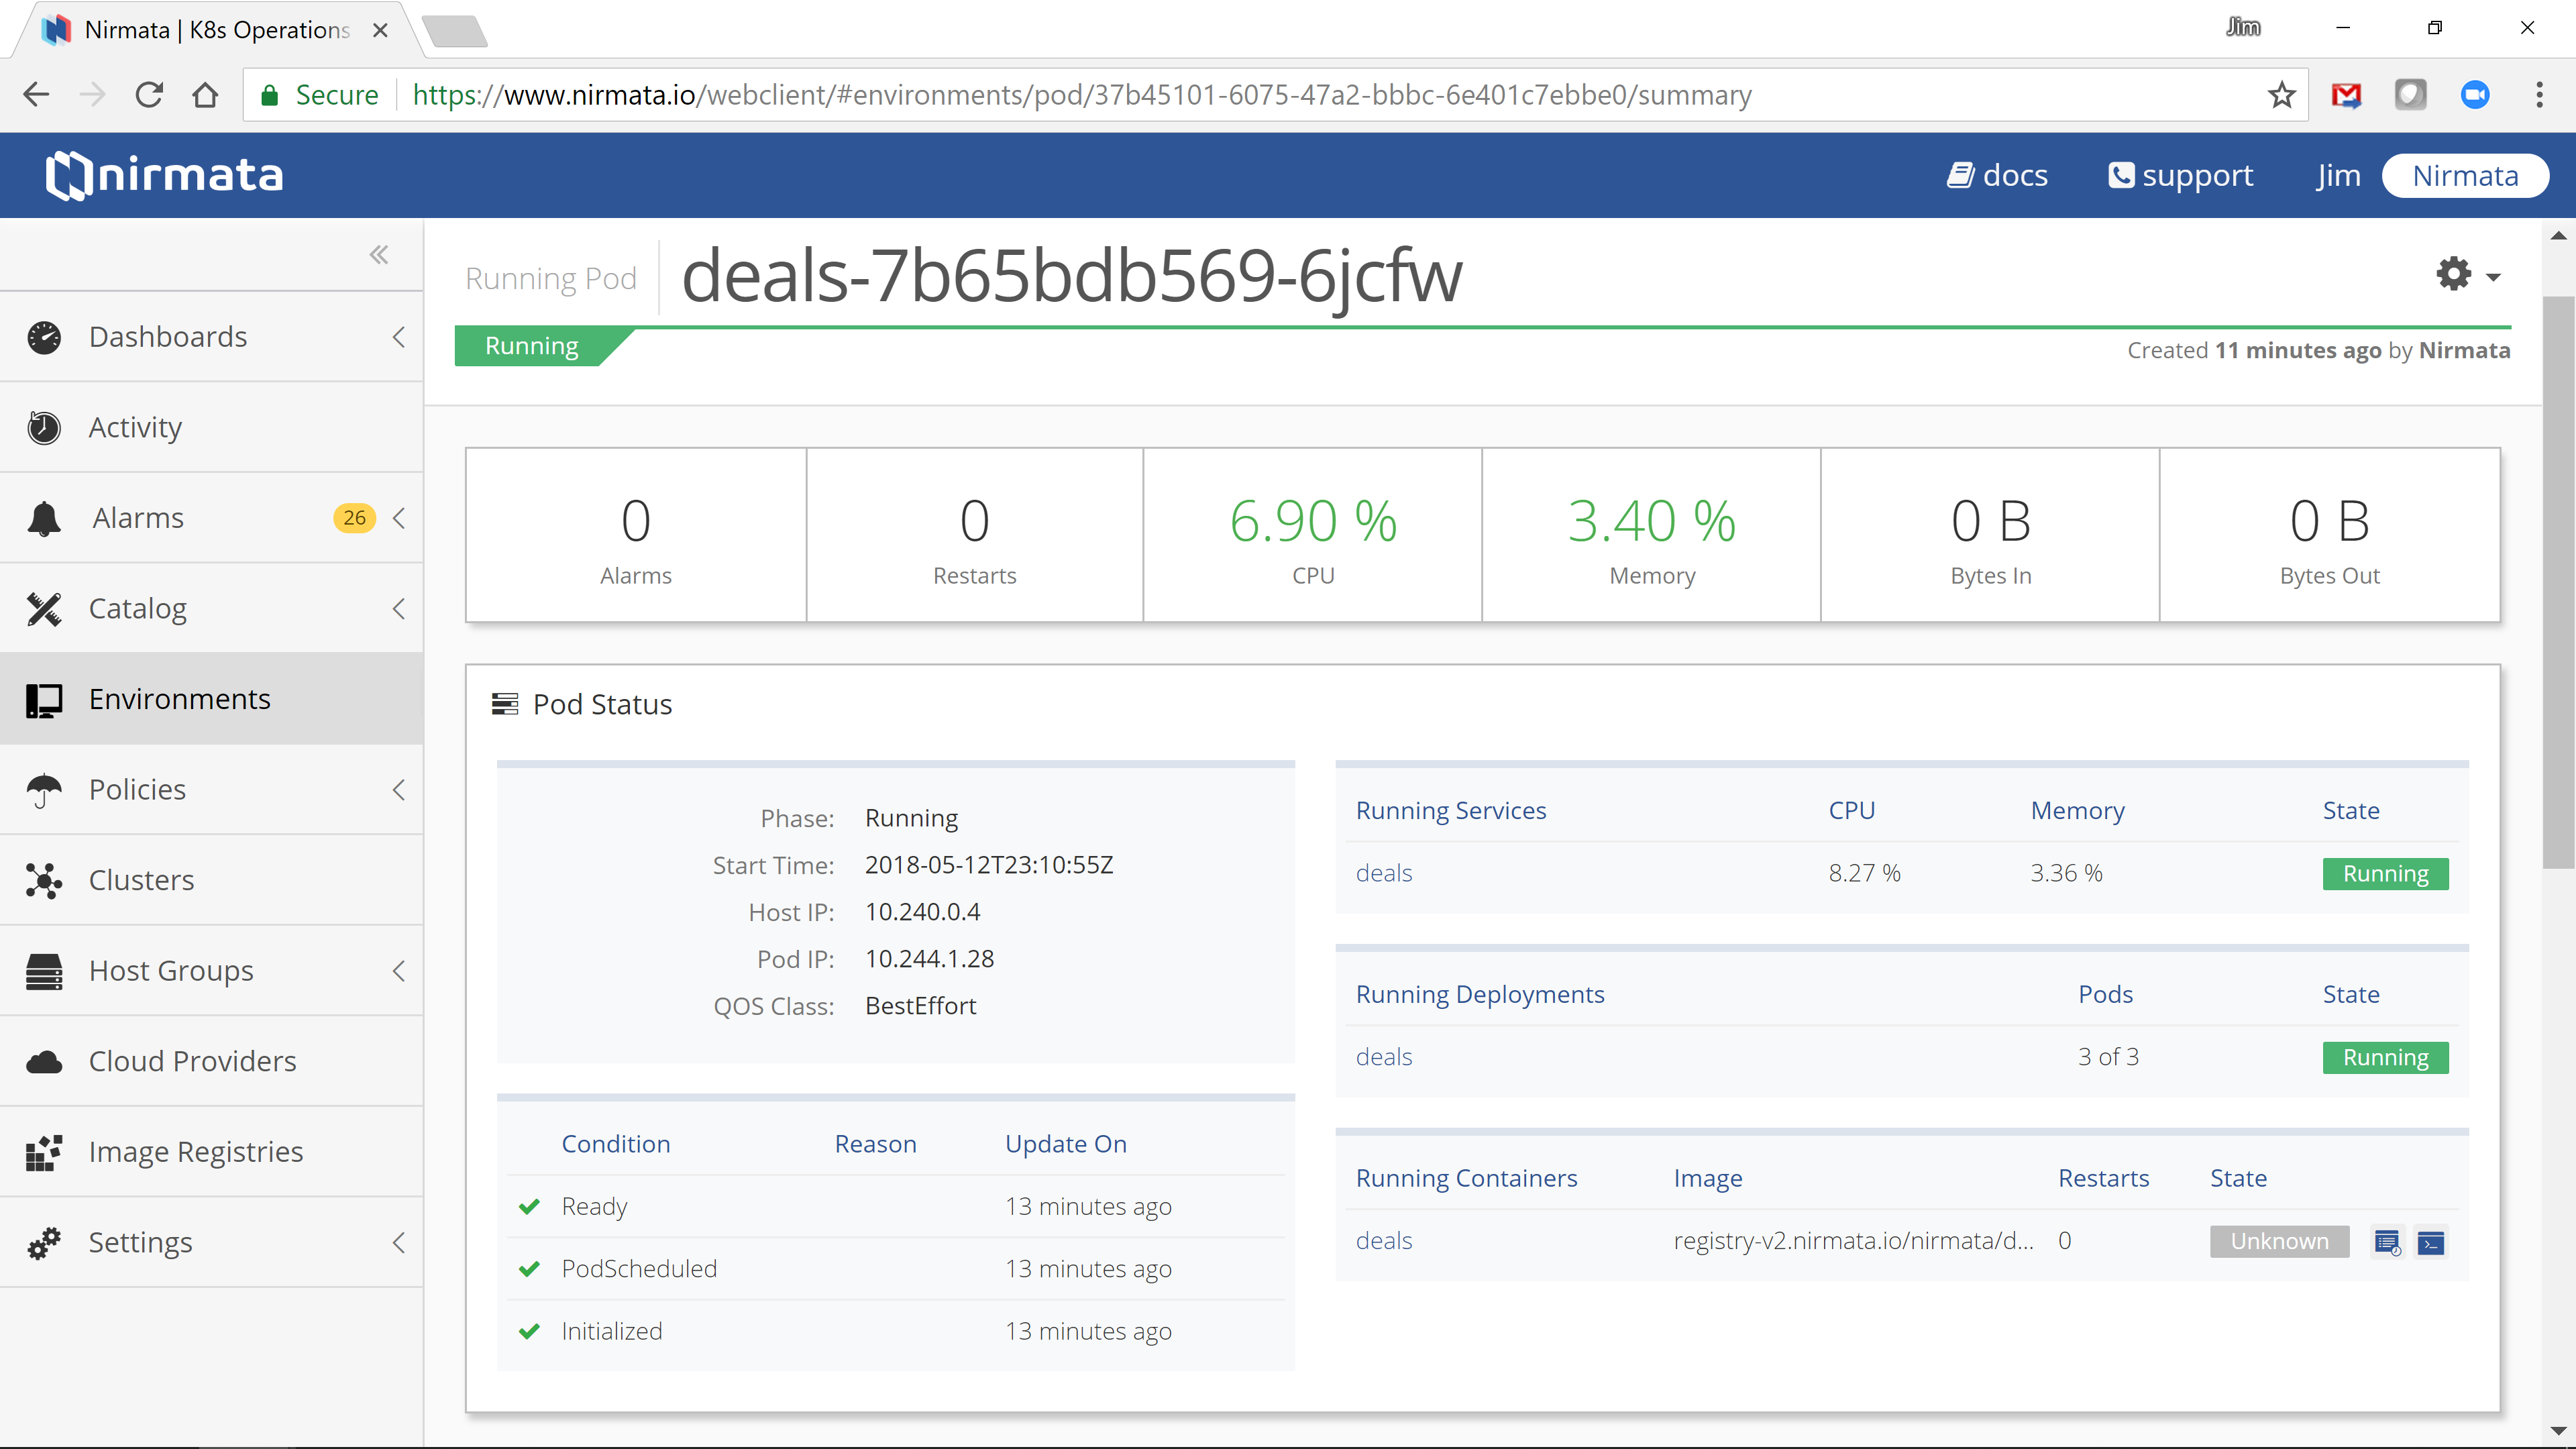
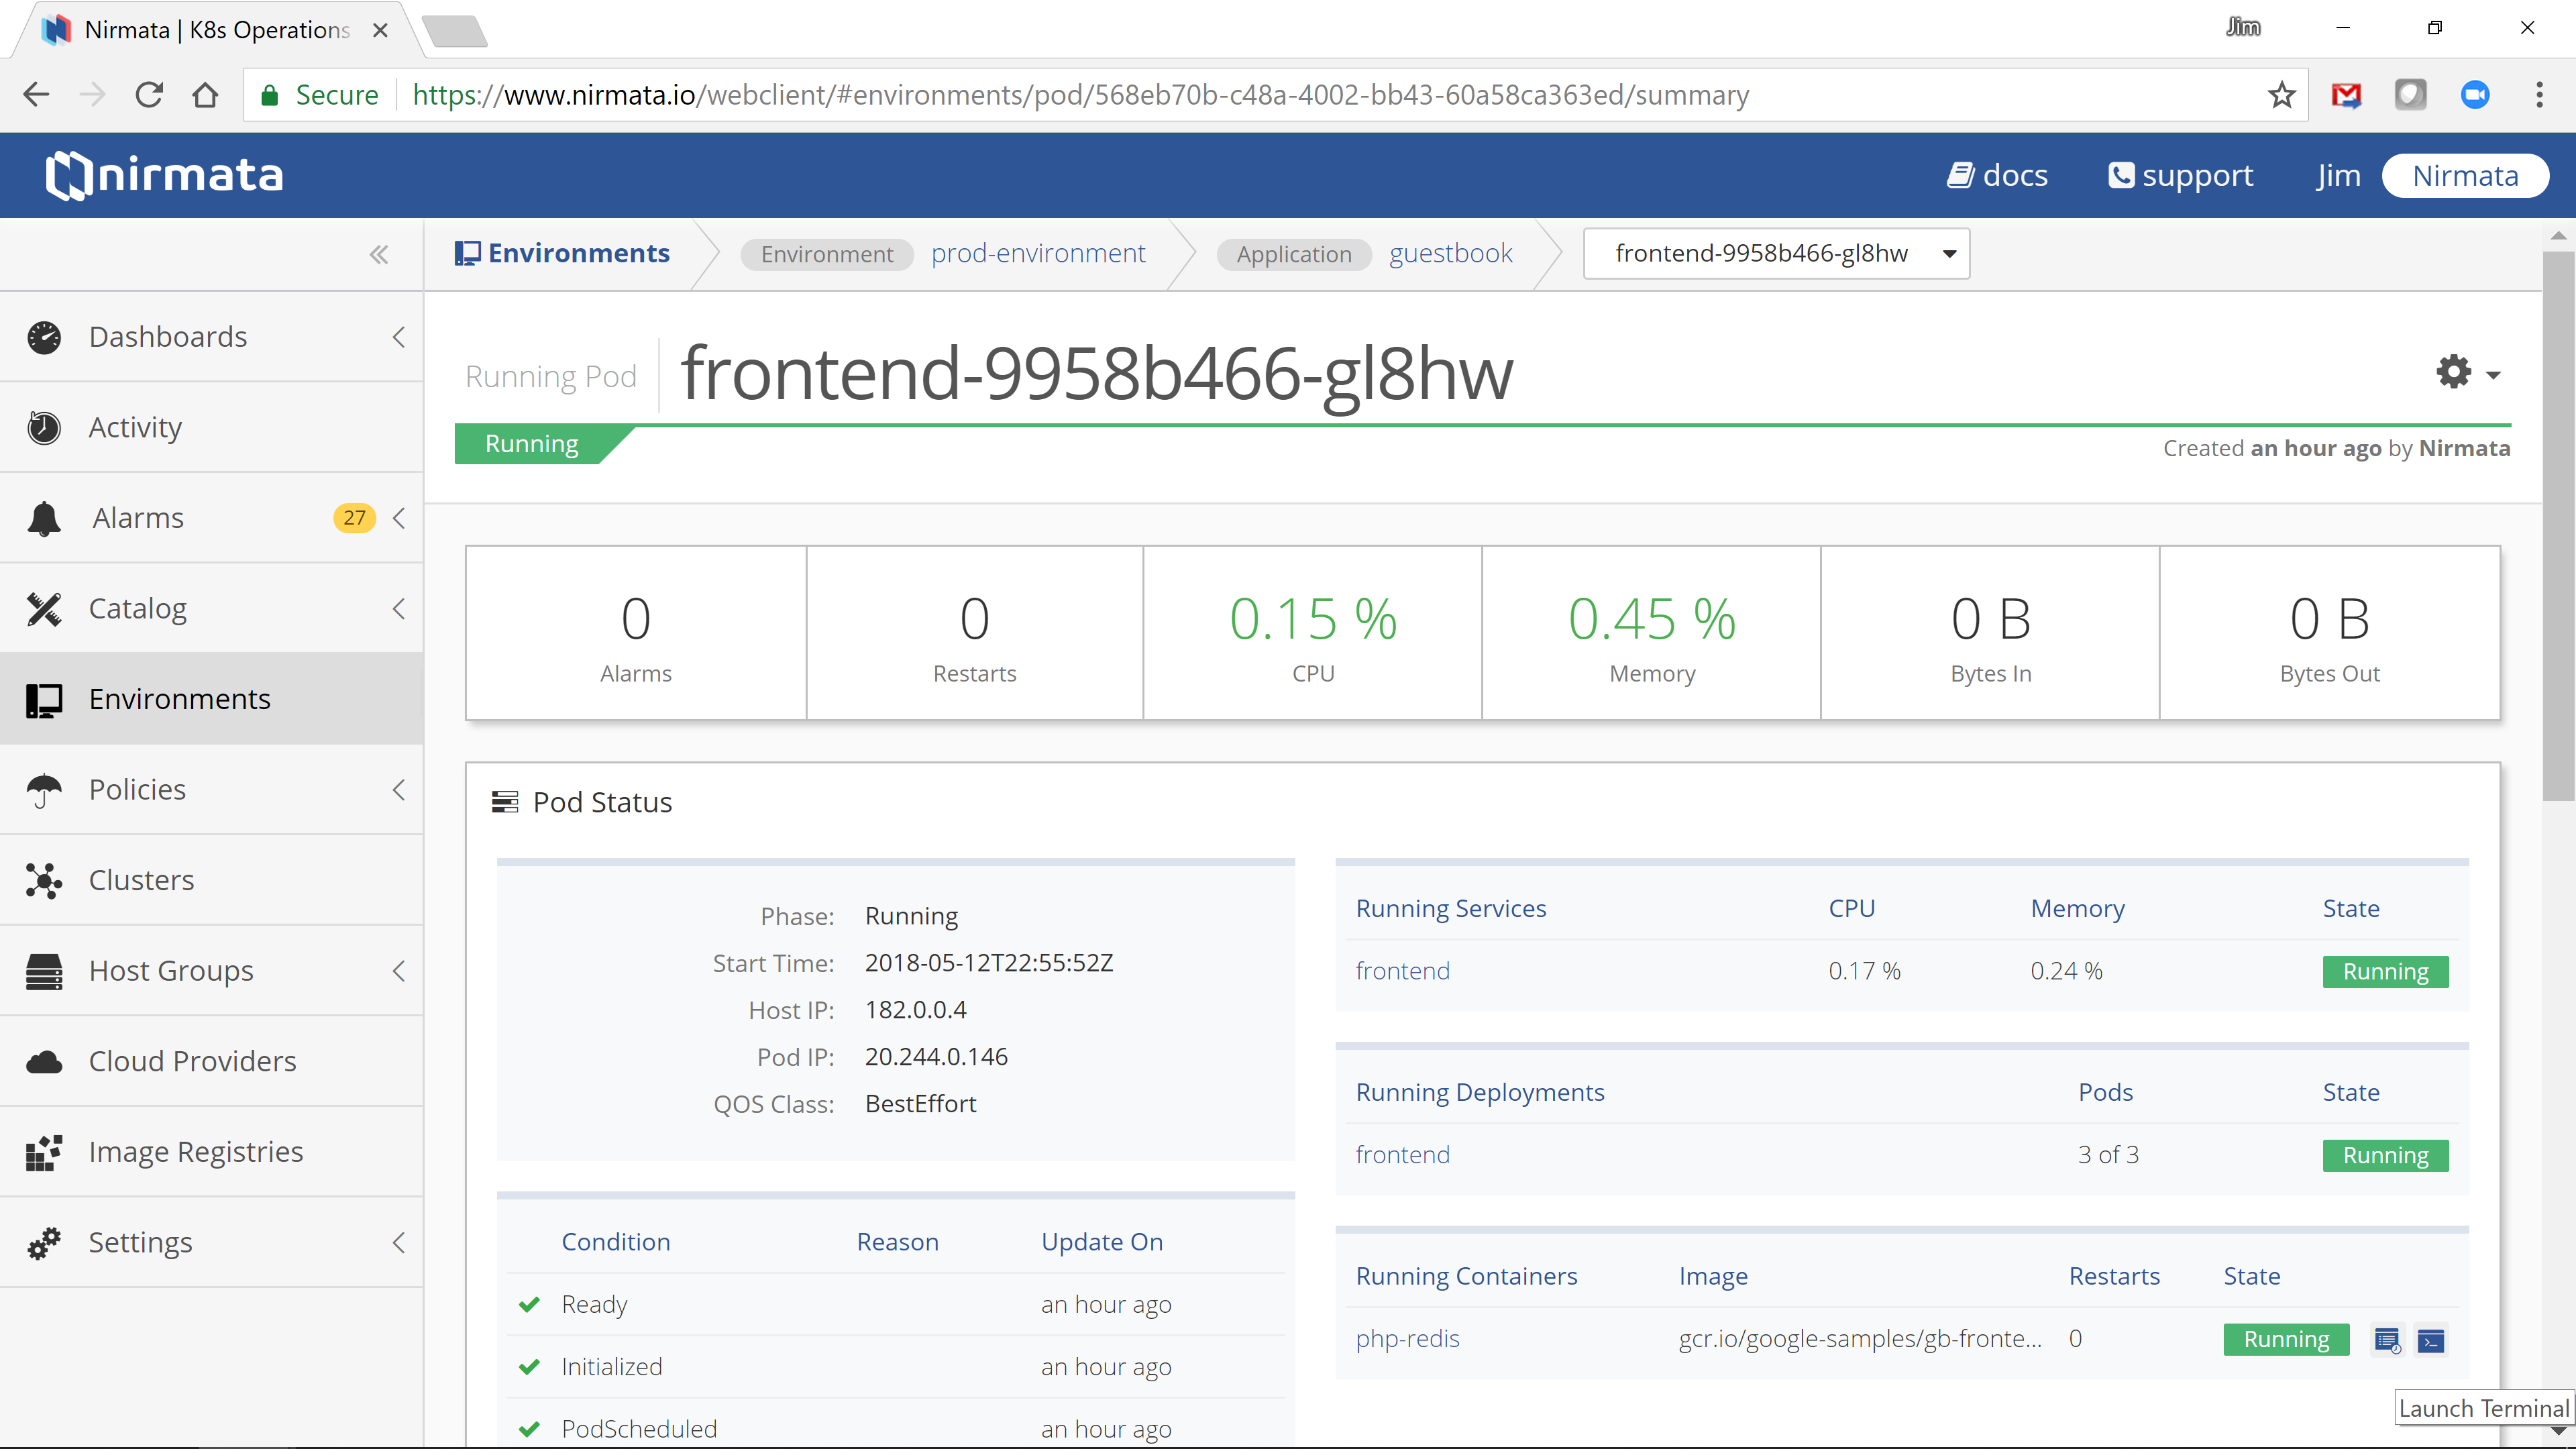
Pod View
To access the Pod View, click on pod name in the Service View. The Pod view displays pod metrics and pod-specific Resources.
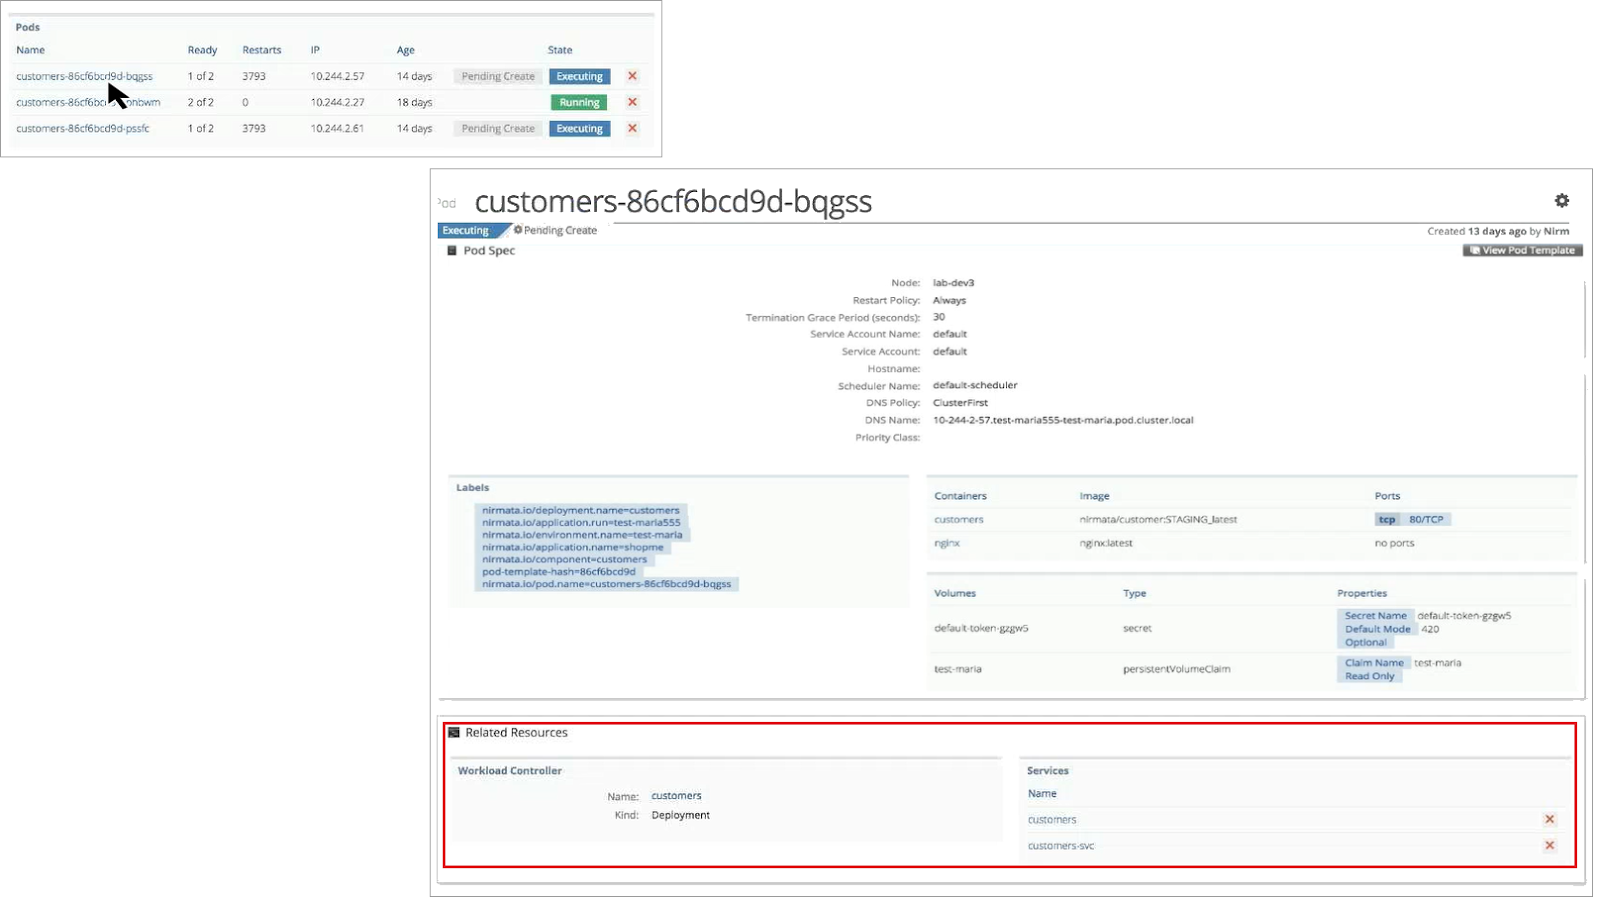
The Related Resources panel displays the Workload Controller and Services for the specified pod.
Container Template View
To access the Container Template View, click on container name in the Pod View. The Container Template view displays container template metrics.
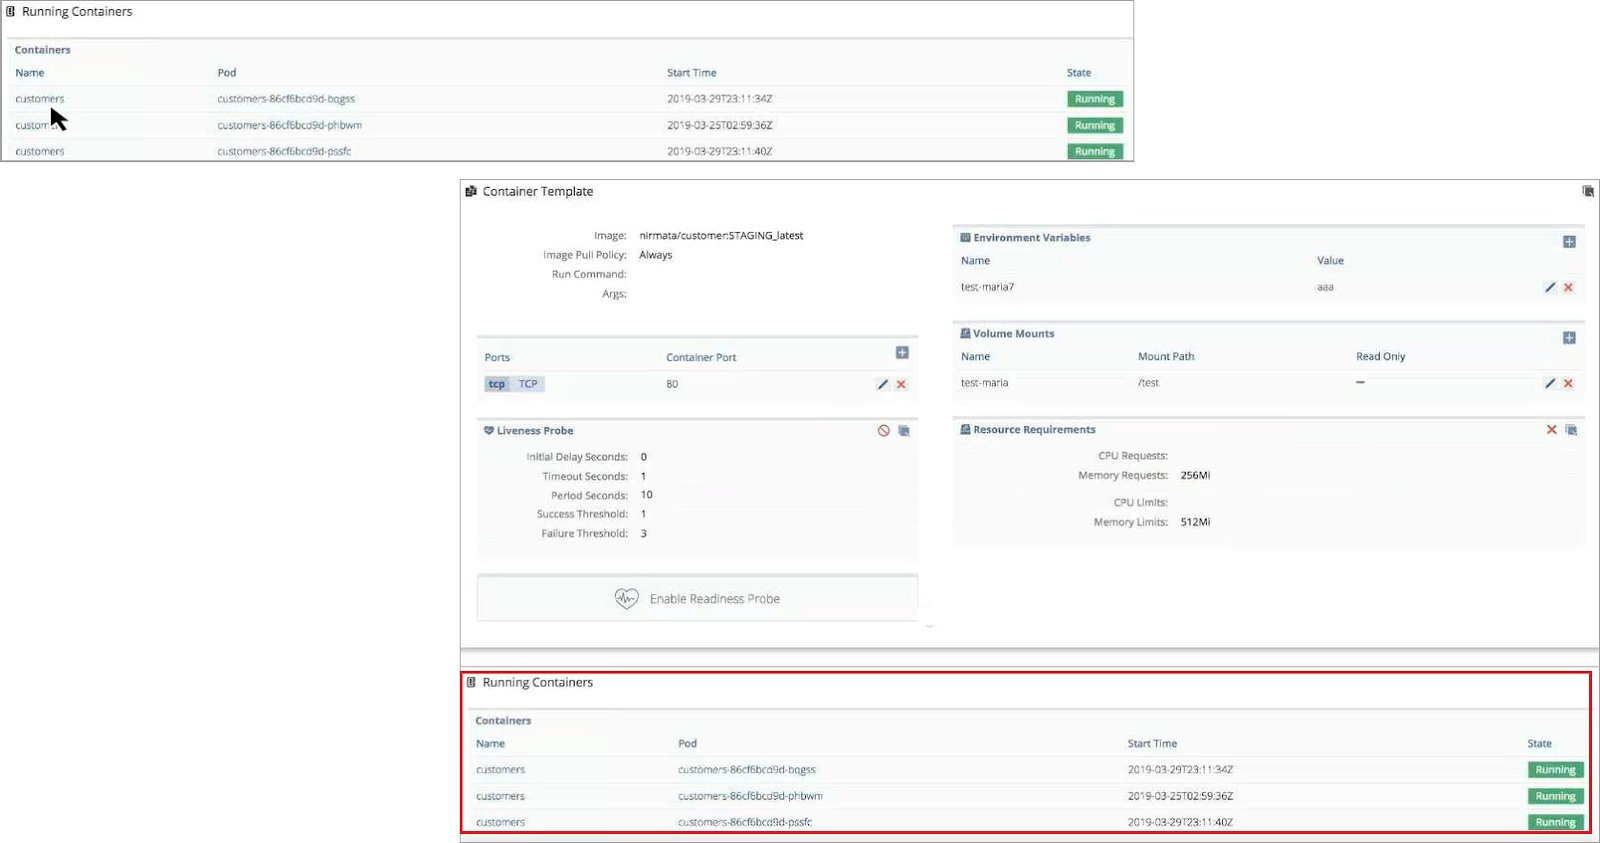
All Running Containers that use the specified template are displayed near the bottom of the page.
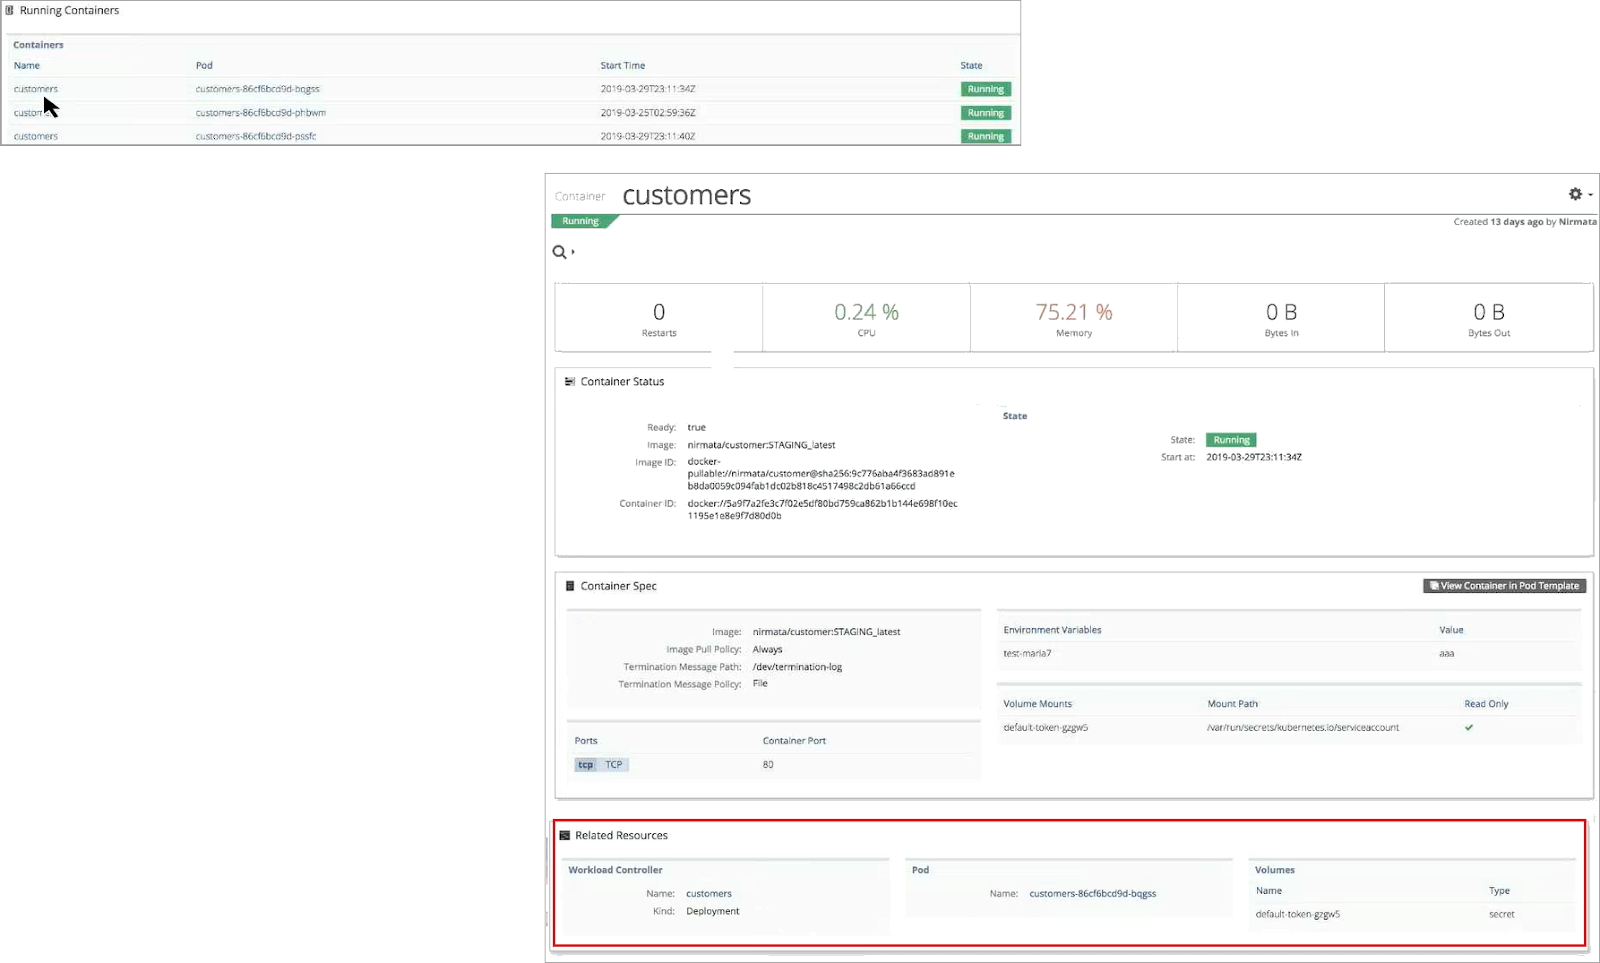
Running Container View
To view a Running Container, click on the container name in the Running Containers panel. The Container detail page displays the Workload Controller, Pod, and Volumes for the specified Container in the Related Resources Panel.
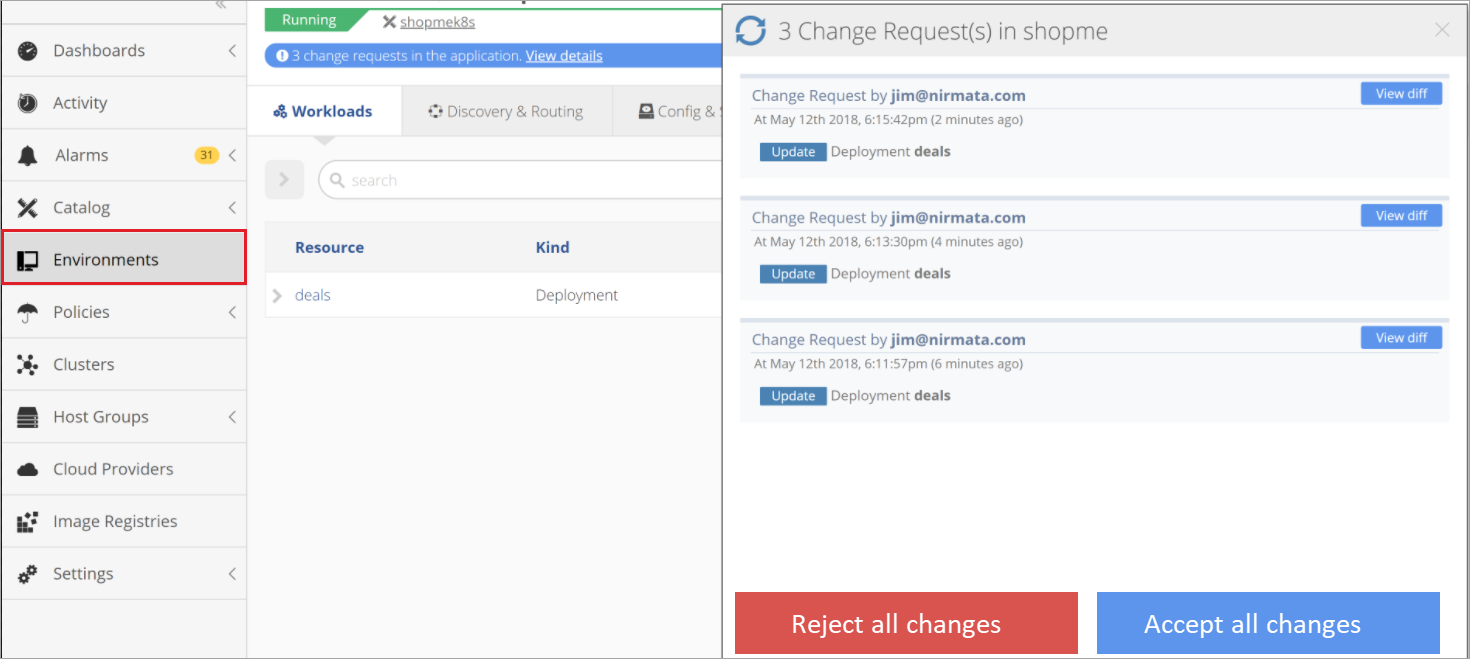
Change Management
Nirmata automatically synchronizes data for every resource cluster.
When an application is modified in the Catalog, Nirmata will propagate the changes to each running instance of the application. The changes will be processed based on the Update Policy of each environment. If the Update Policy is set to “View” a notification is shown when changes are available. You can then view the changes and decide to accept or reject them.
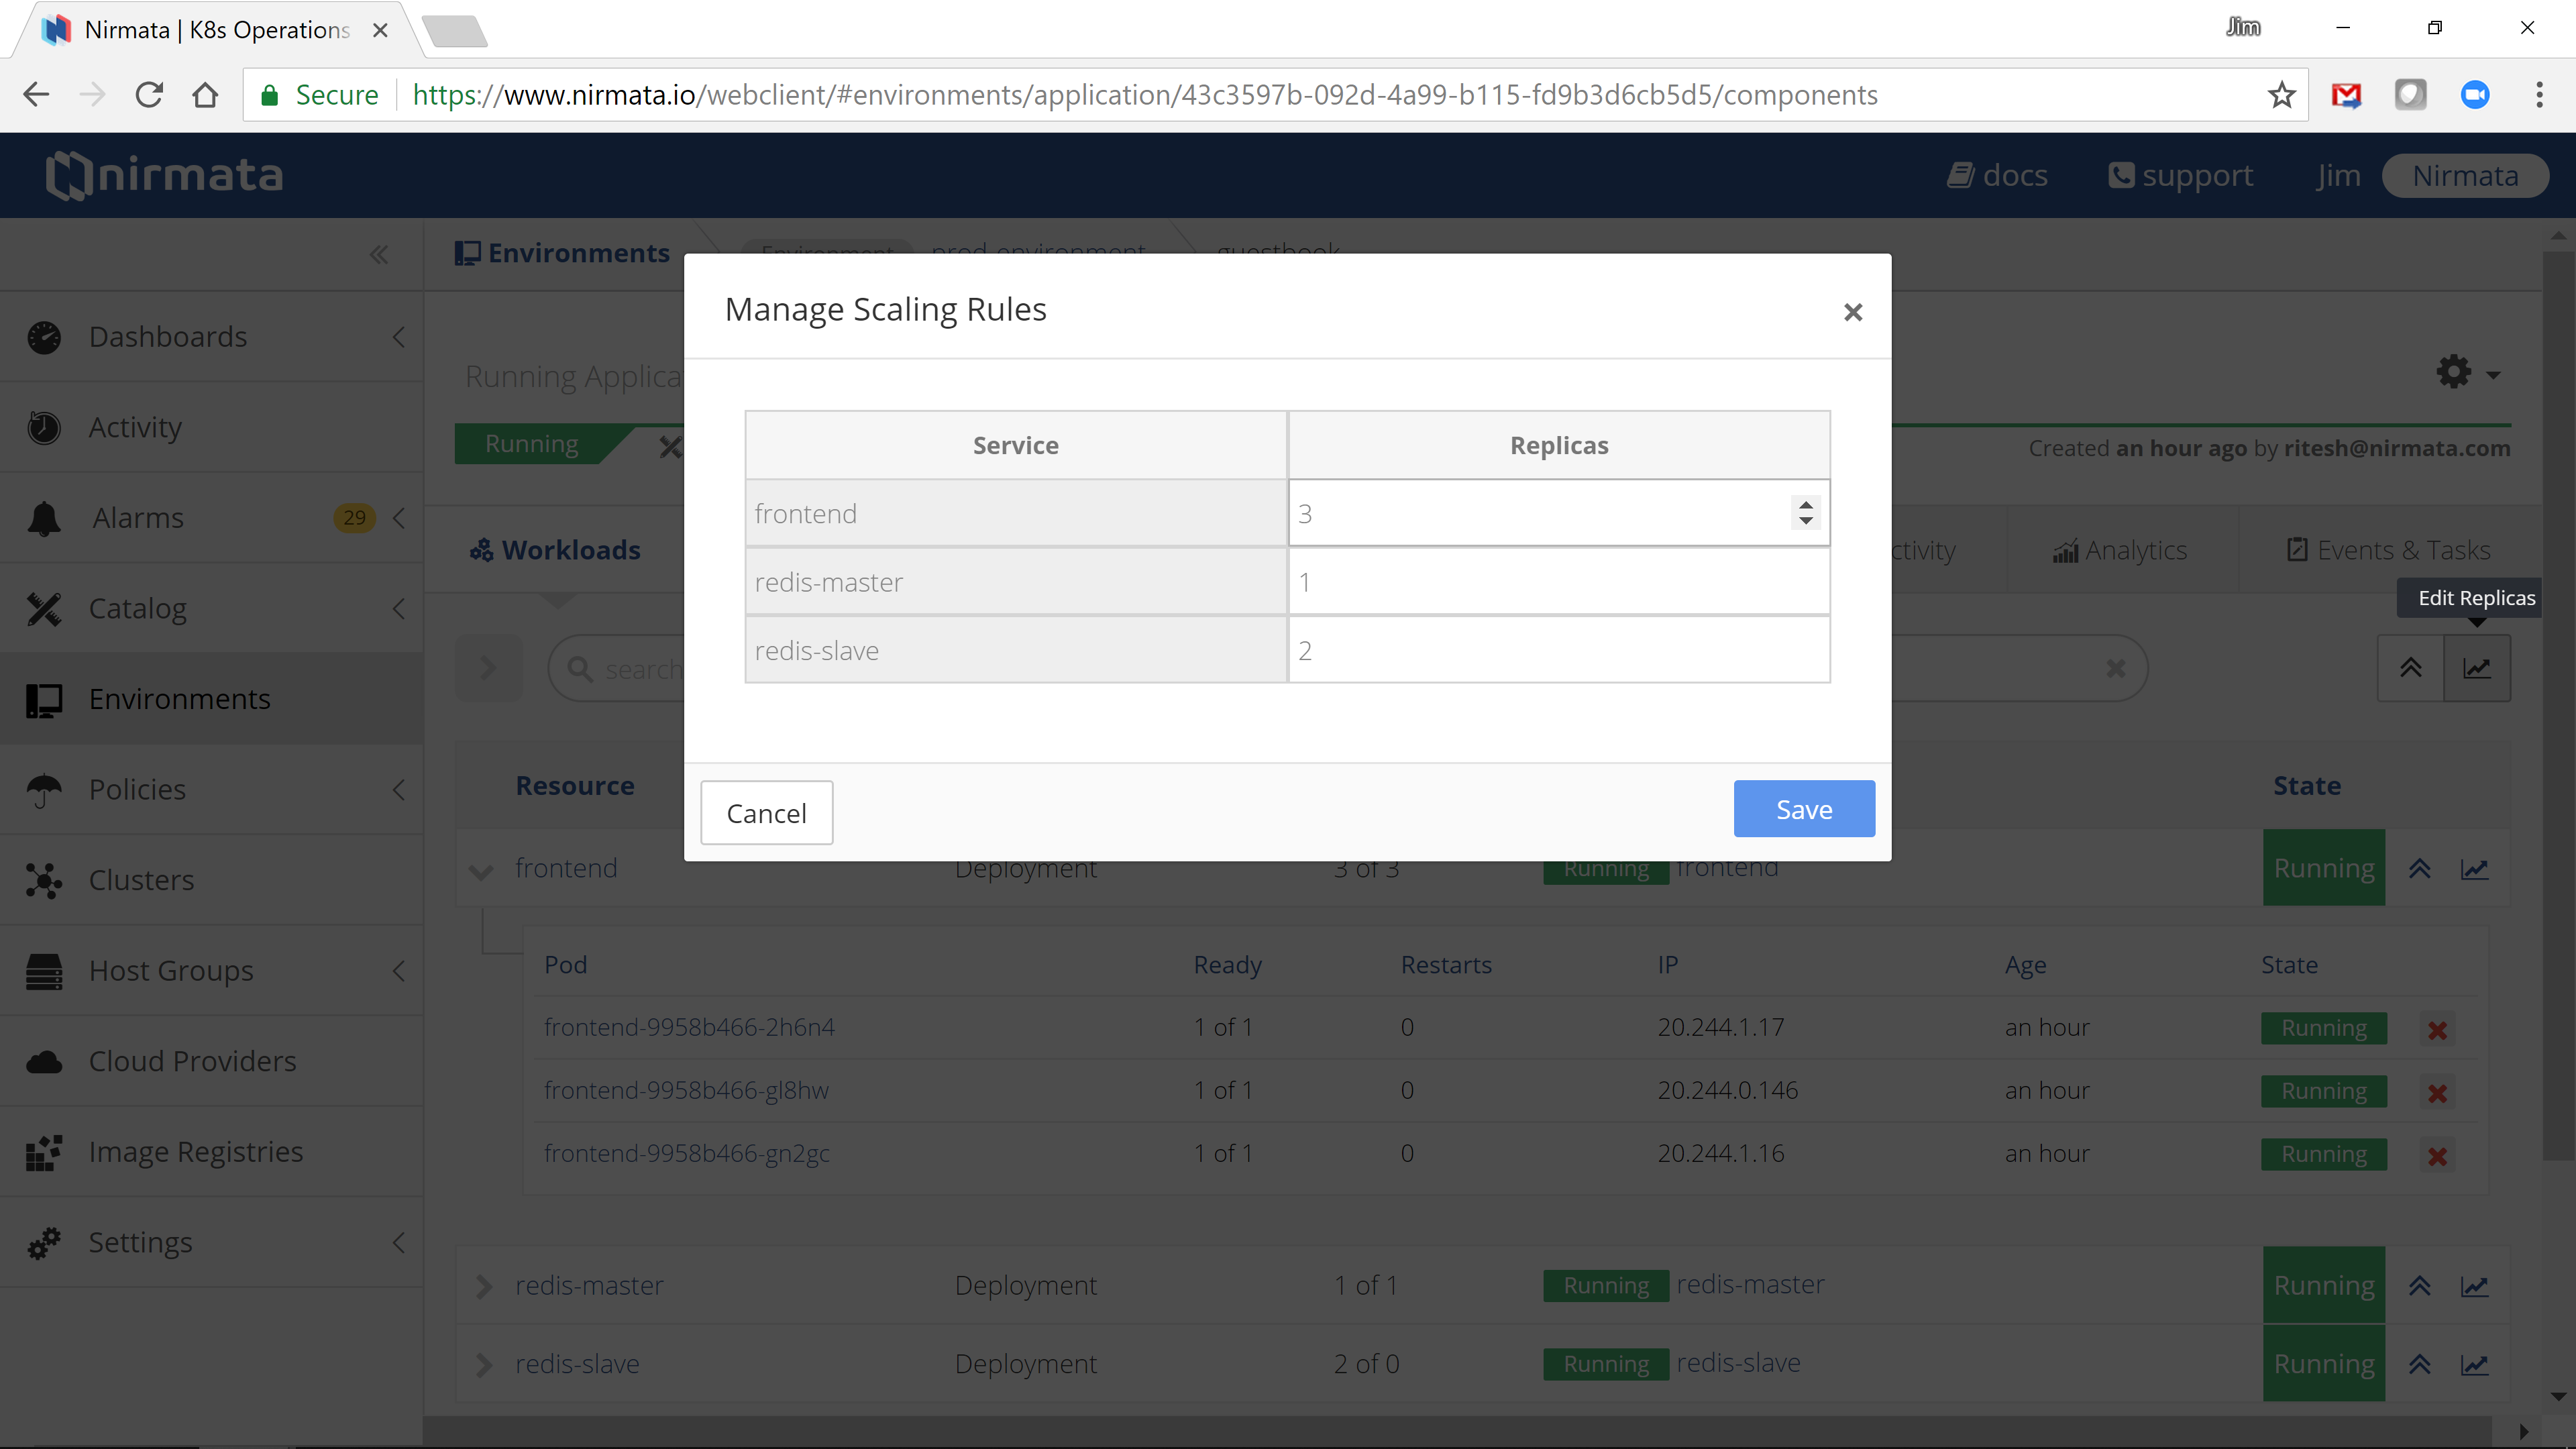
Horizontal Scaling
You can scale Pods for your Deployments or StatefulSets in a running Application. Simply select the scaling icon next to a component, or at the top right of the components table and set the desired replica counts.
Tip: To automate pod scaling based on metrics define a Horizontal Pod Autoscaler as part of your application.
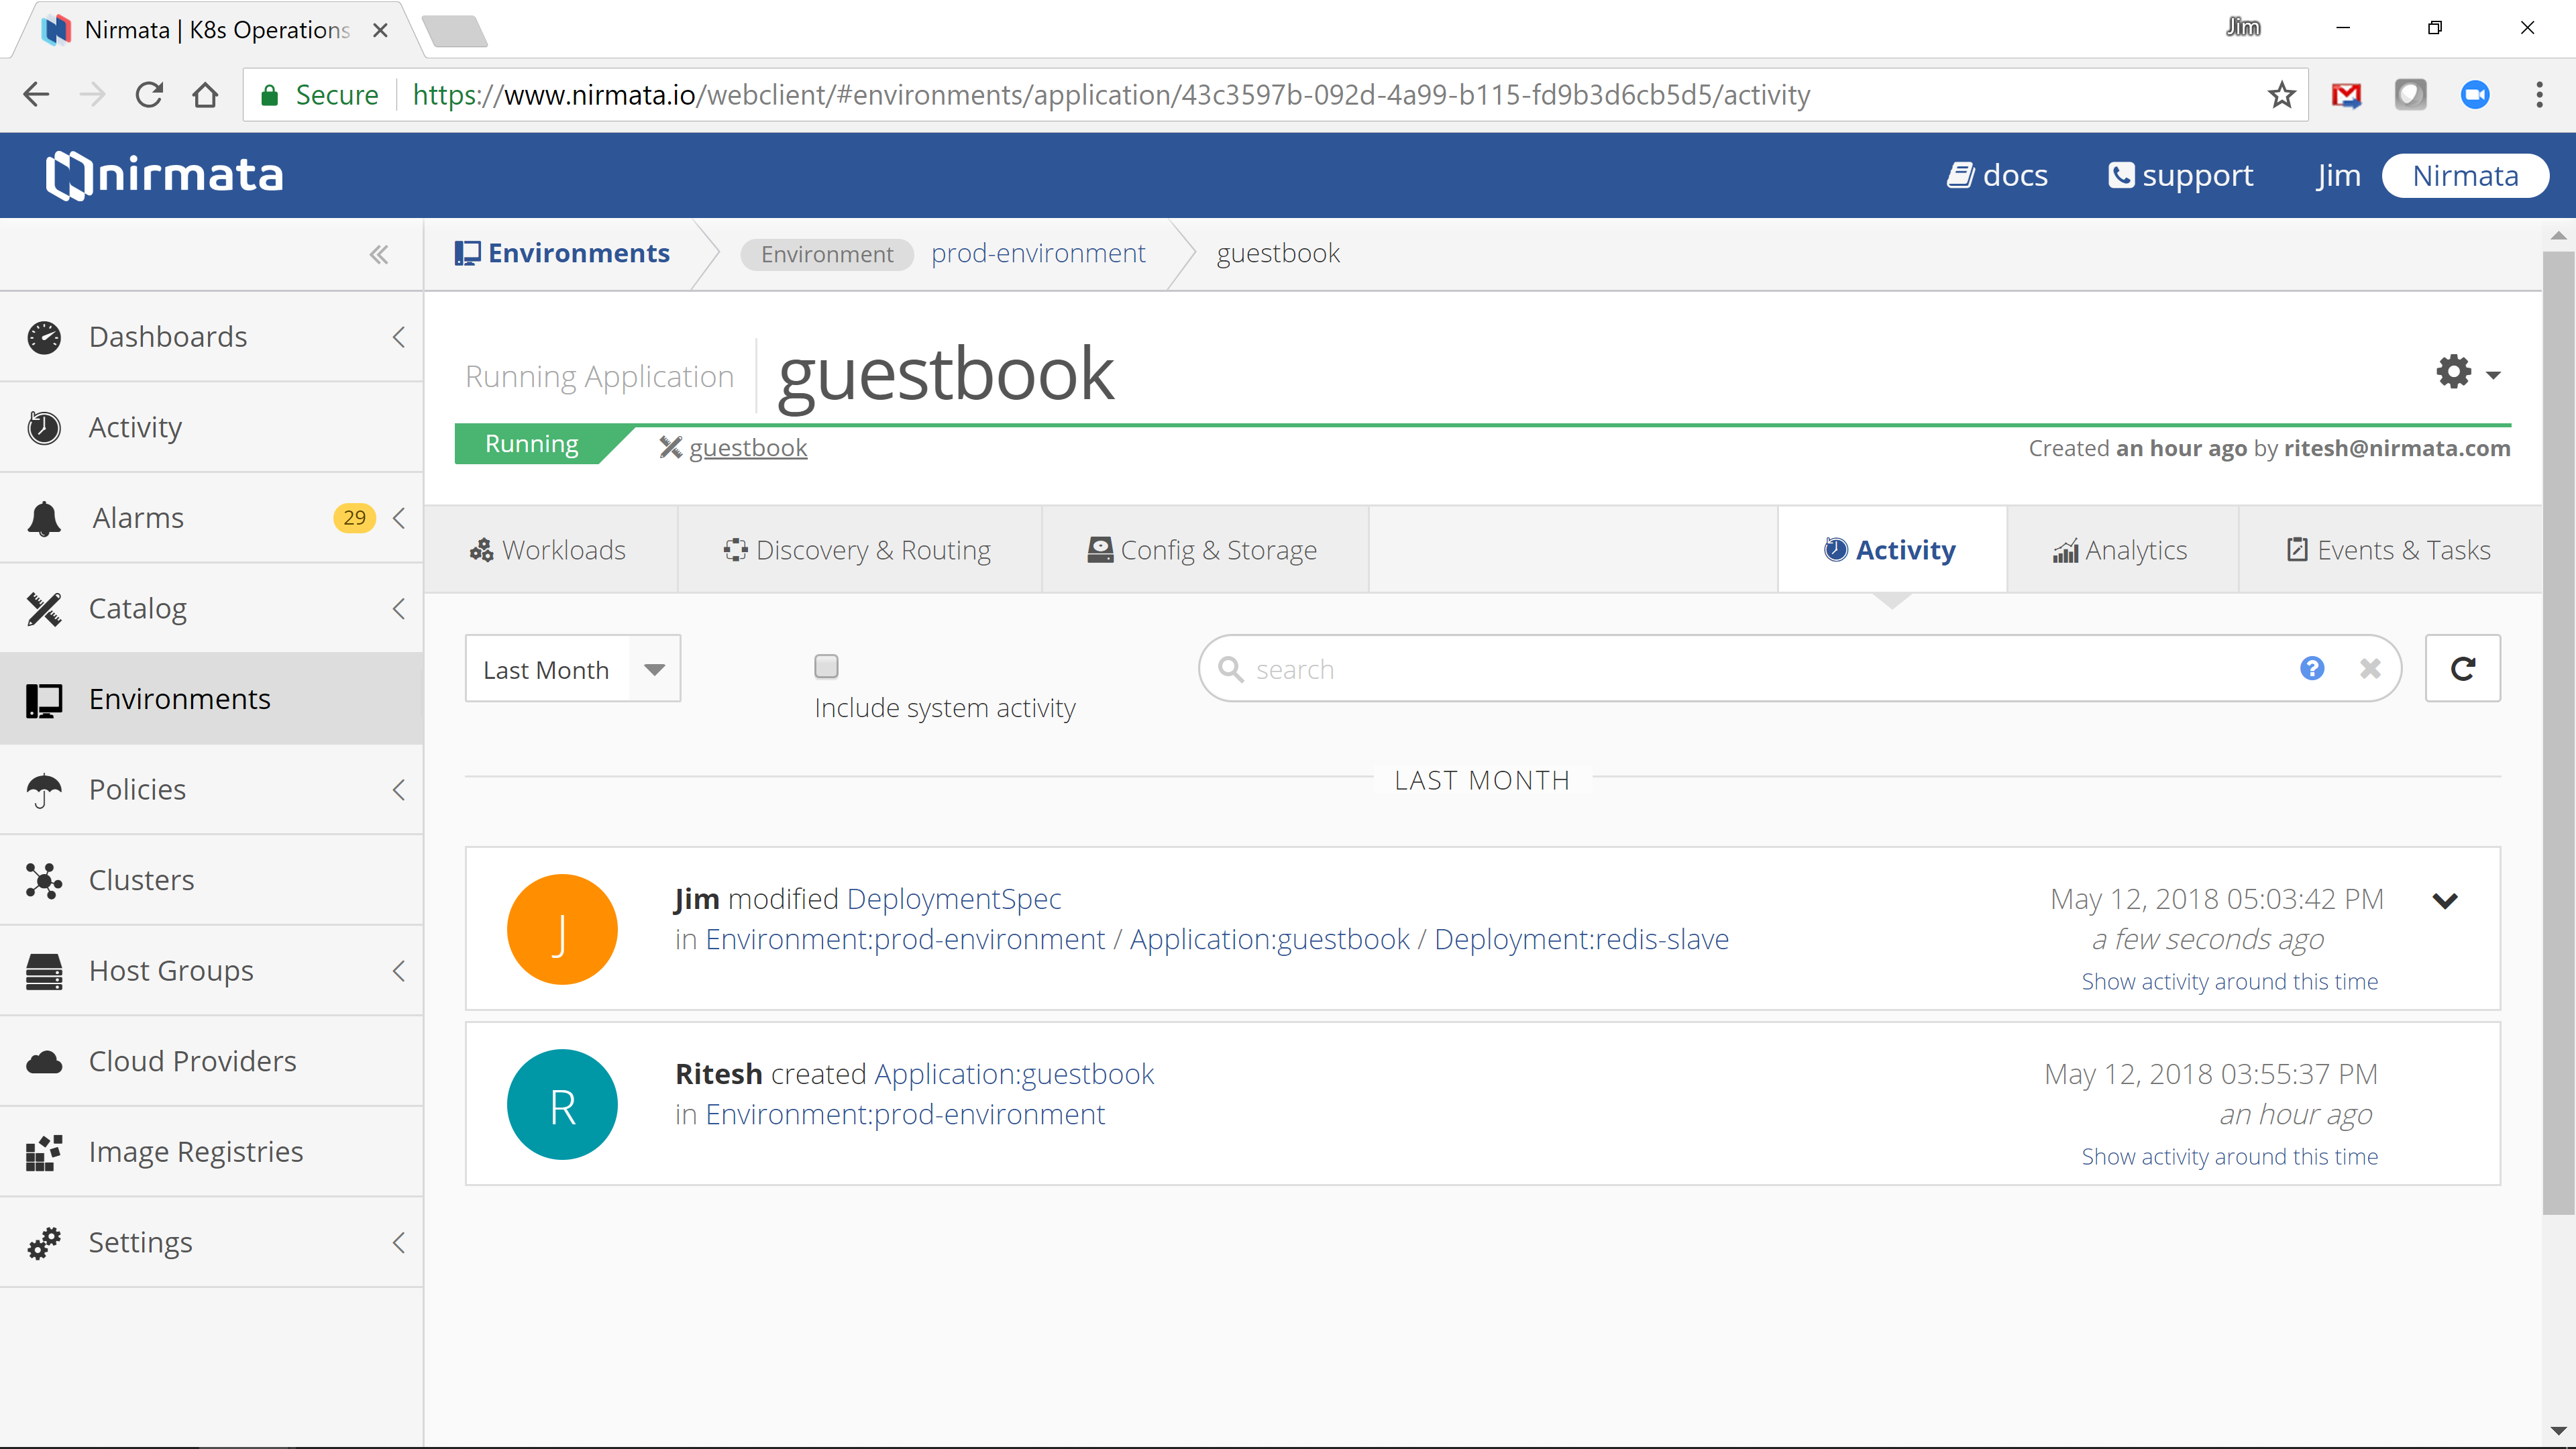
Activity
Nirmata automatically tracks and correlates all user and system changes made to applications. You can view all activity for an application in the activity panel:
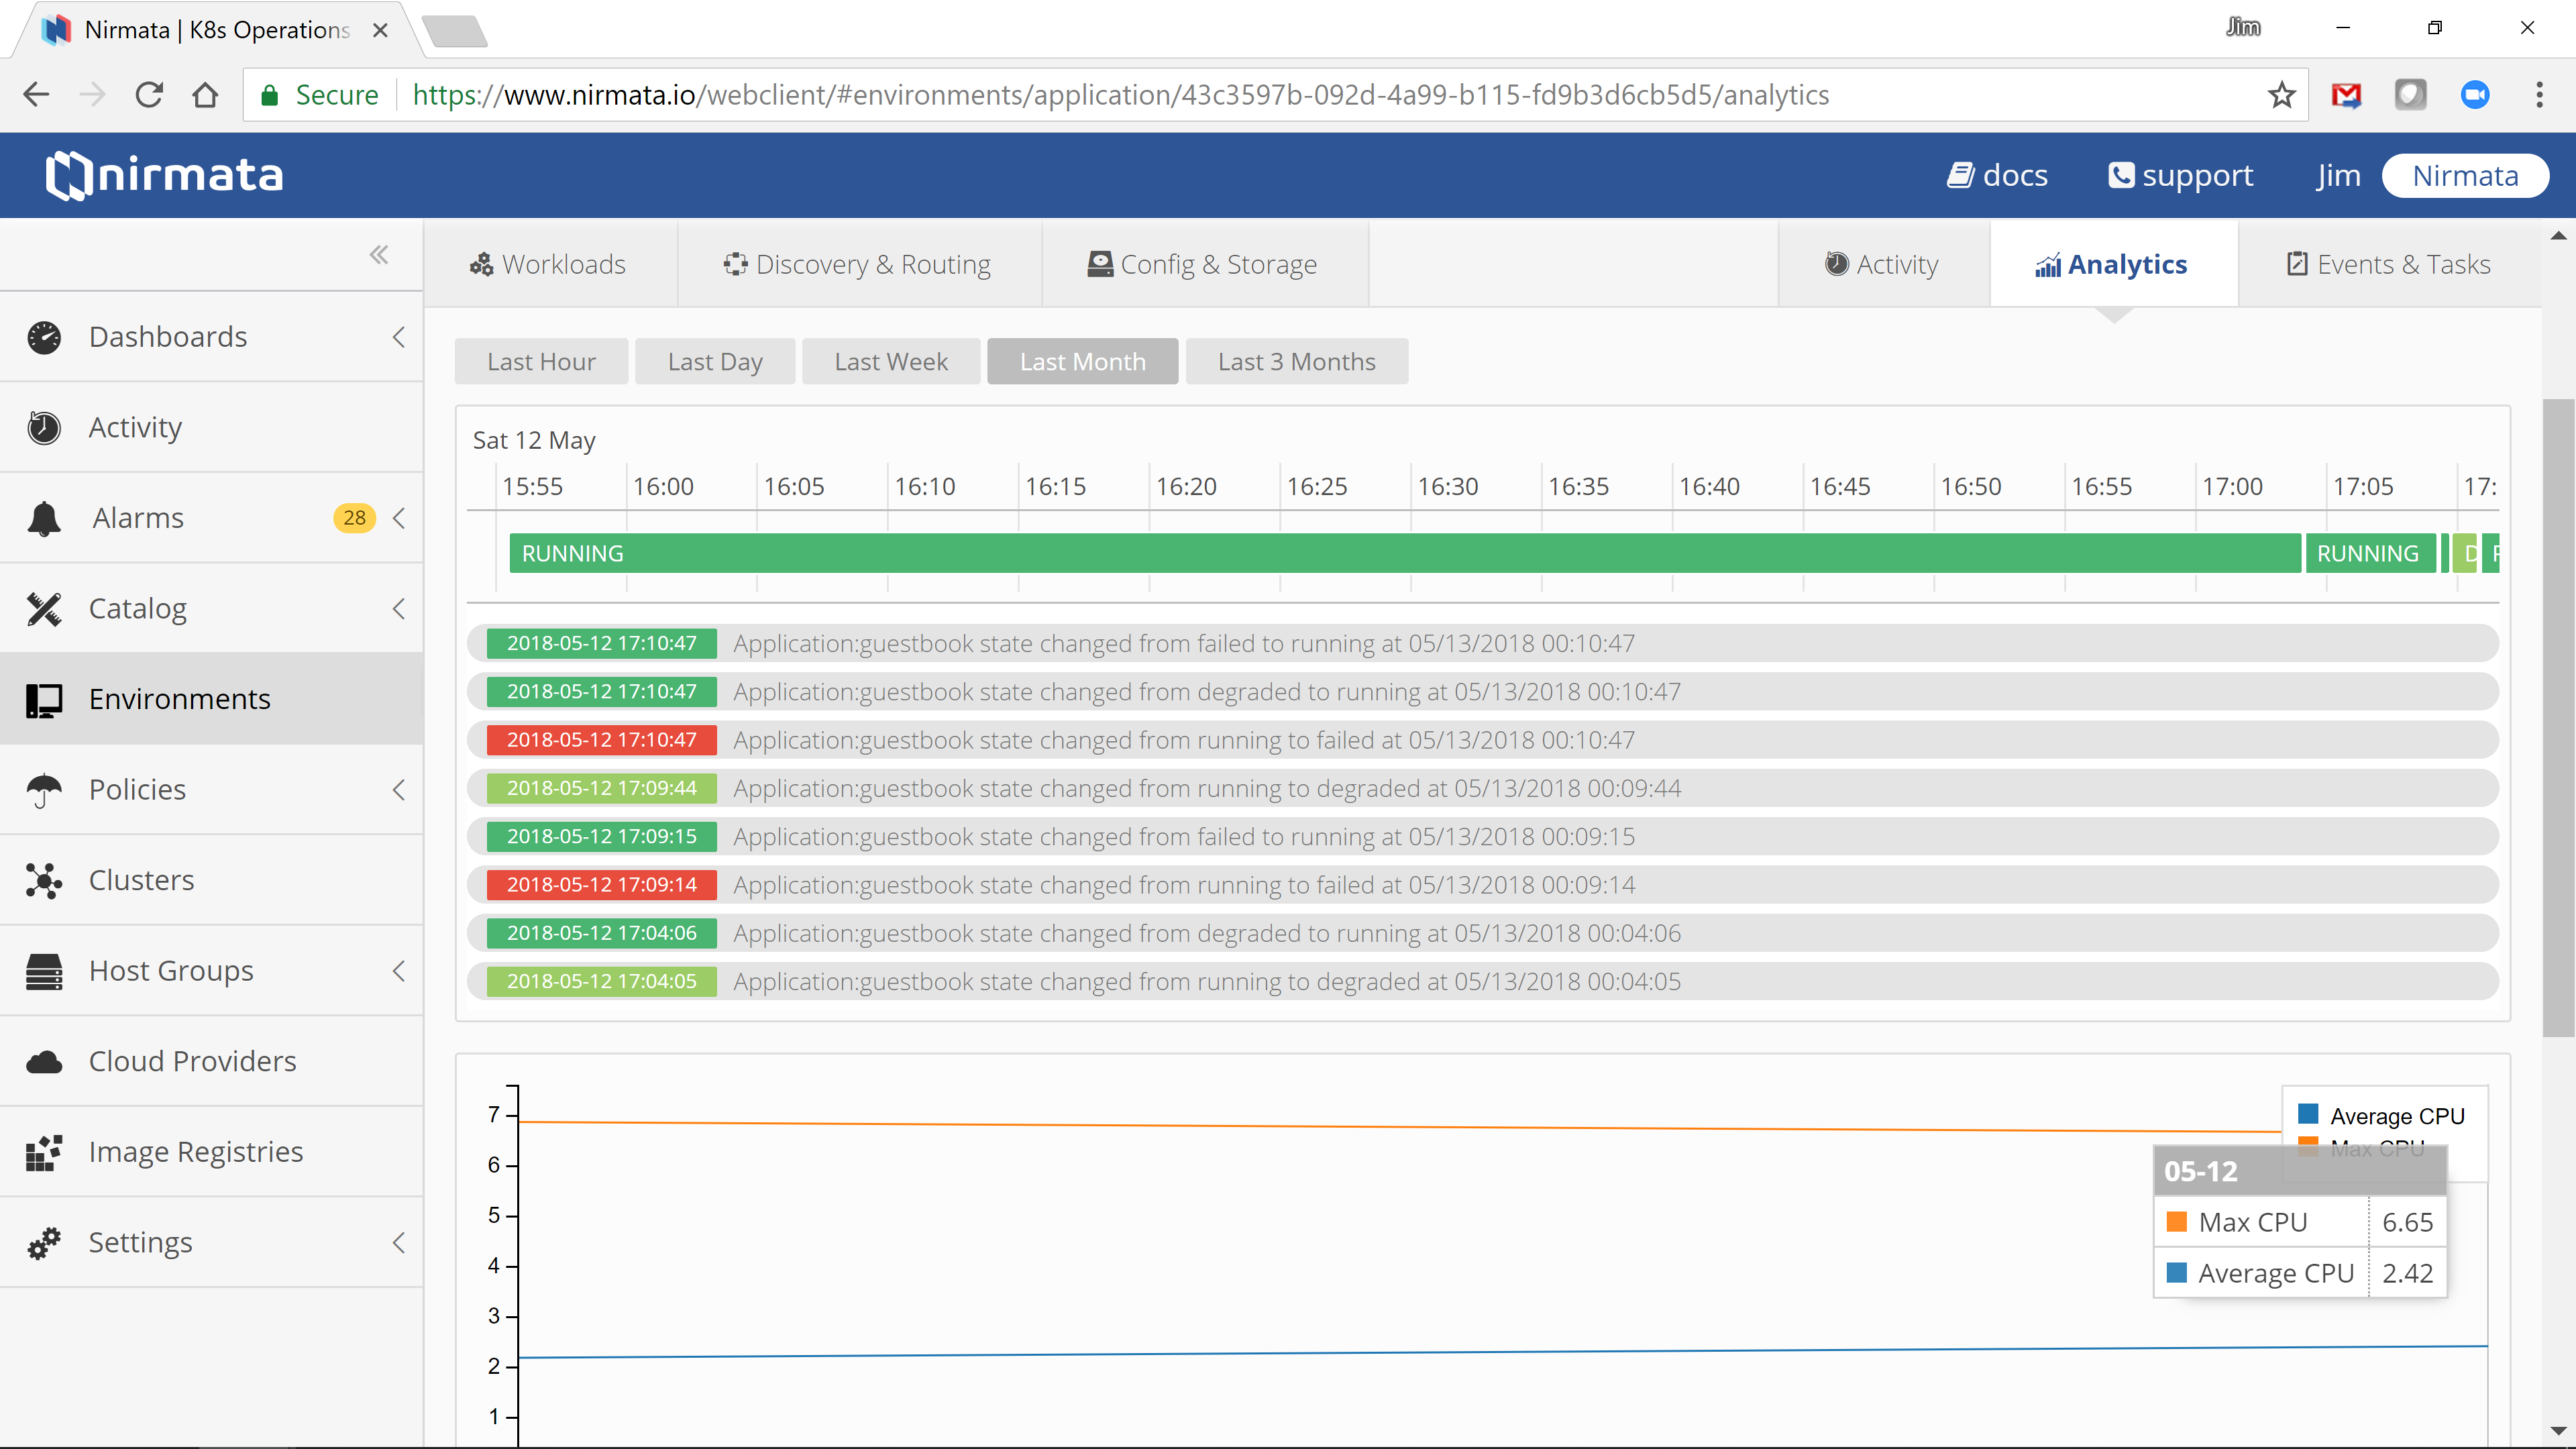
Metrics
Nirmata collects and aggregates several statistics from each Pod and automatically aggregates them by components and applications. You can view these statistics (aggregated) at the application level, or for an individual resources:
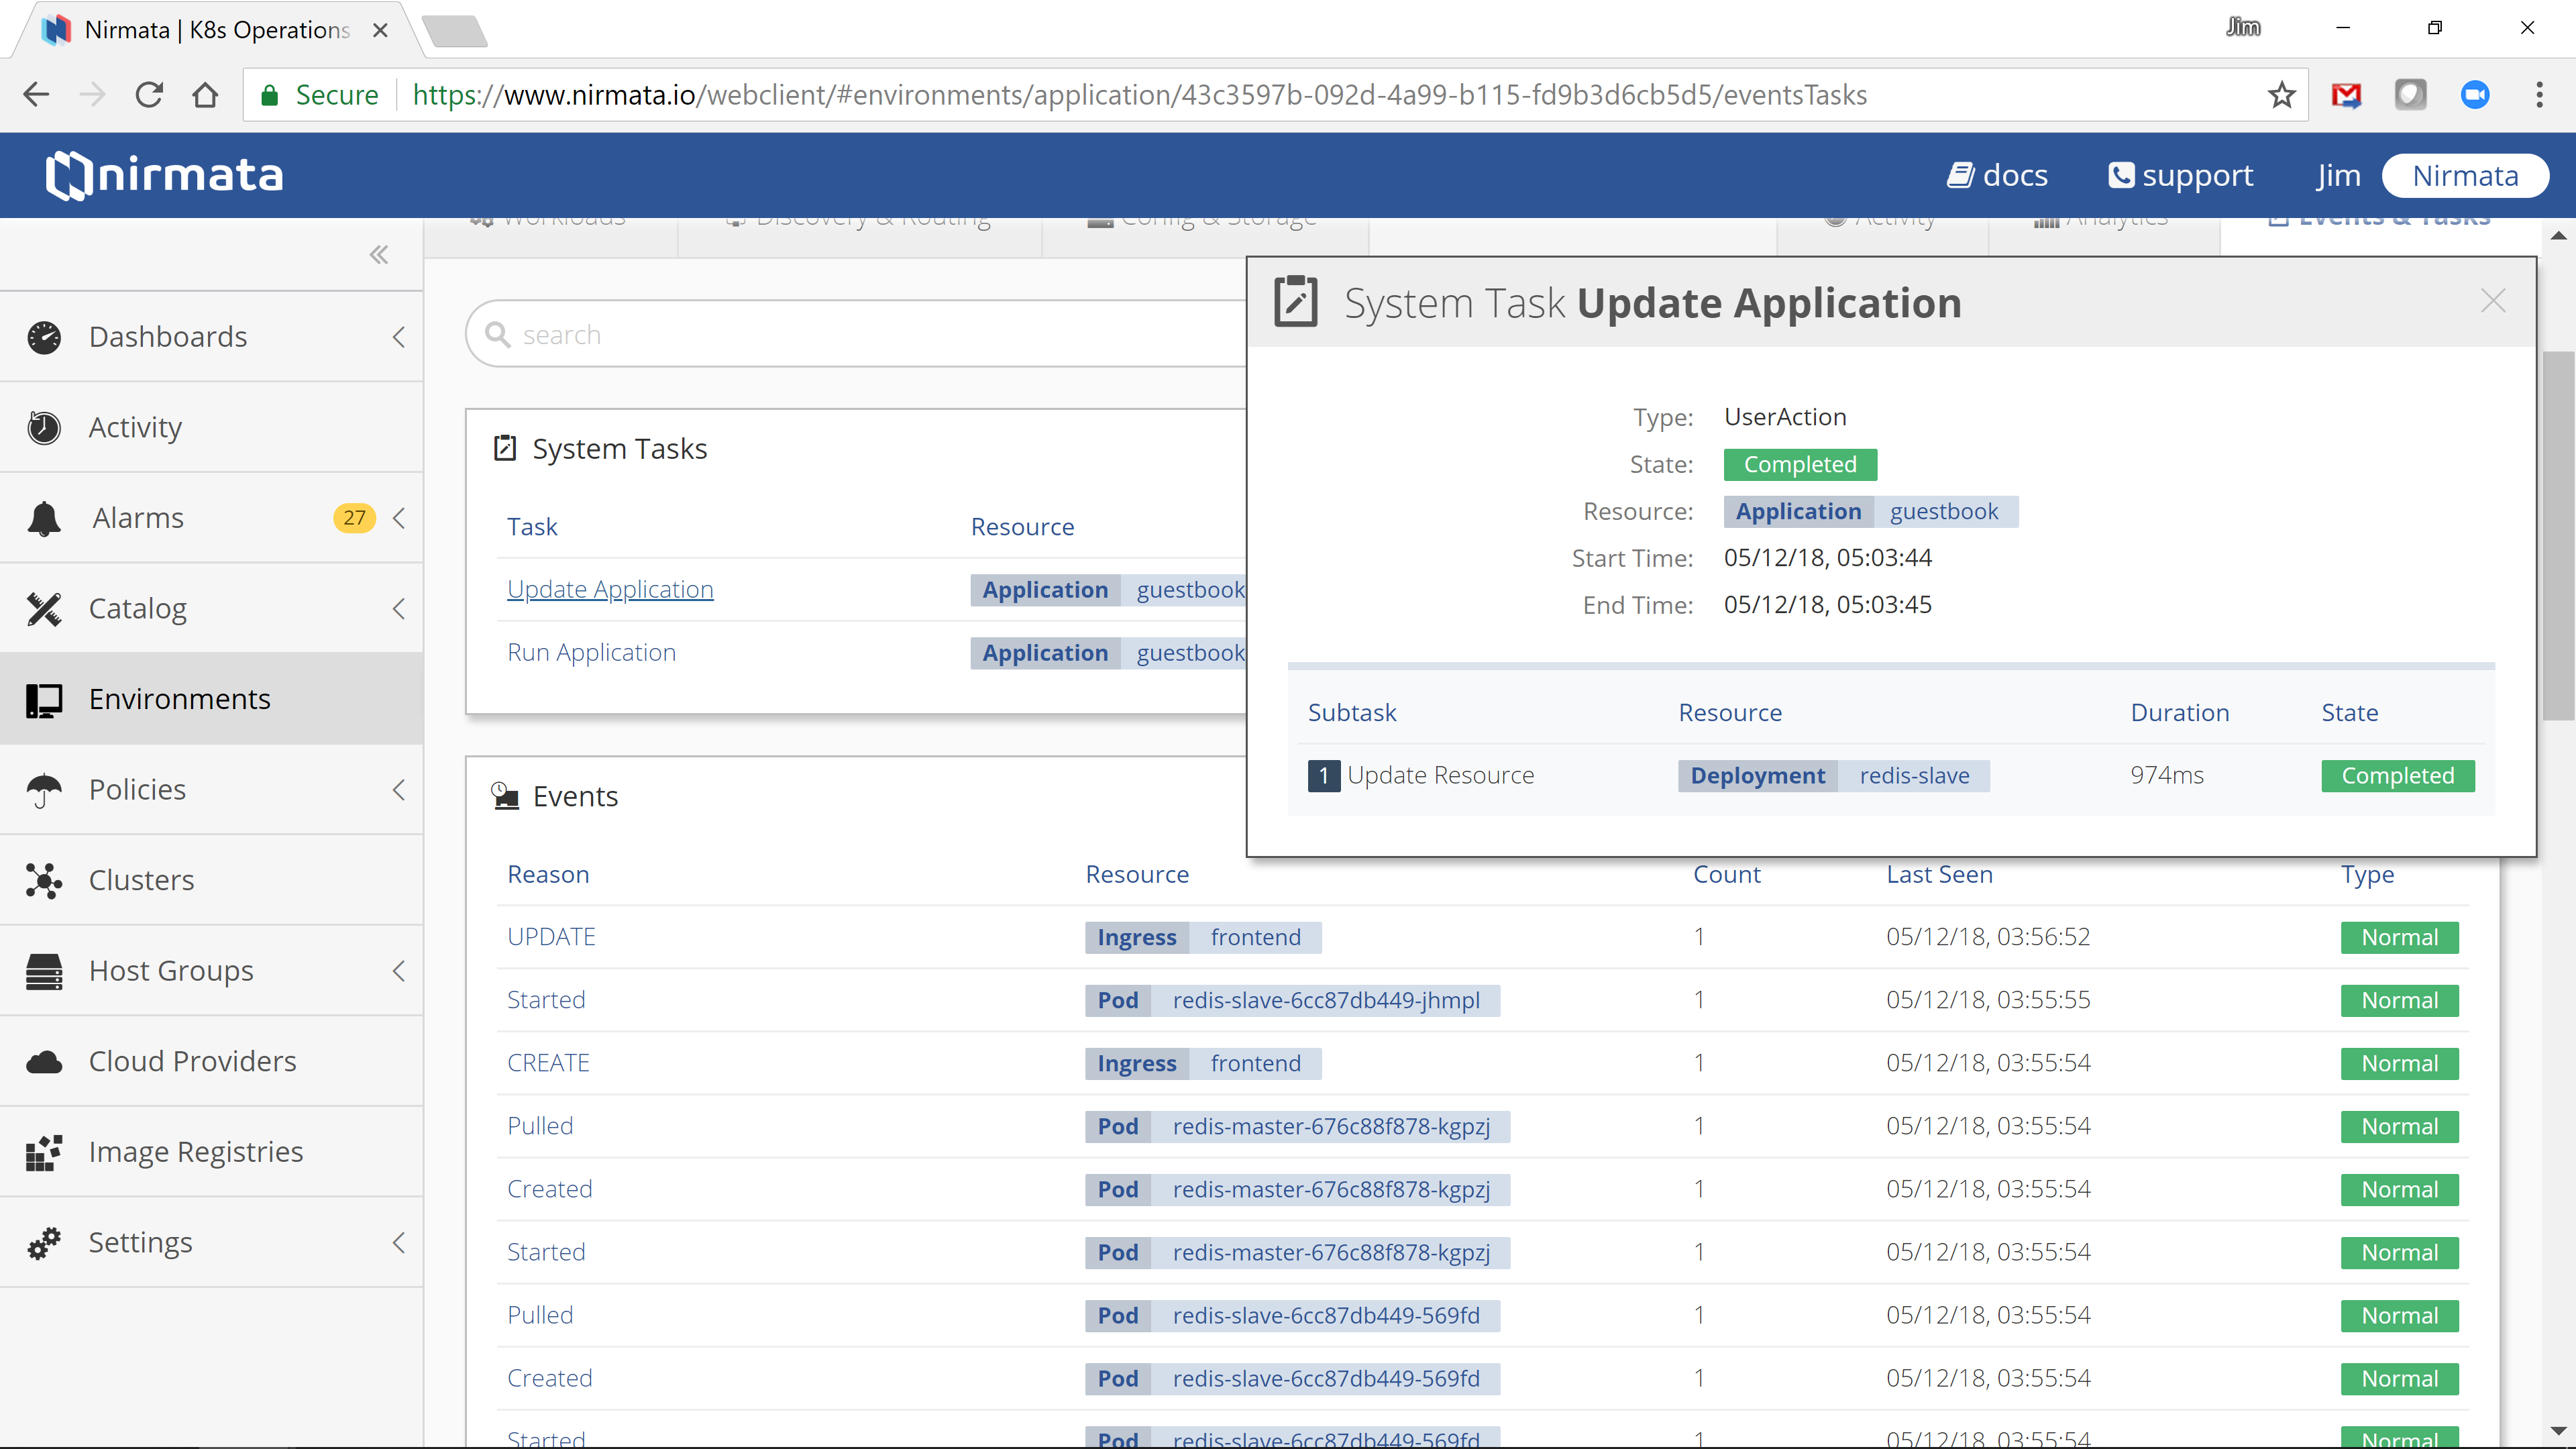
Events & Tasks
Nirmata records all Kubernetes tasks performed (e.g. API calls) and also records events received from Kubernetes. This makes it very easy to troubleshoot application issues:
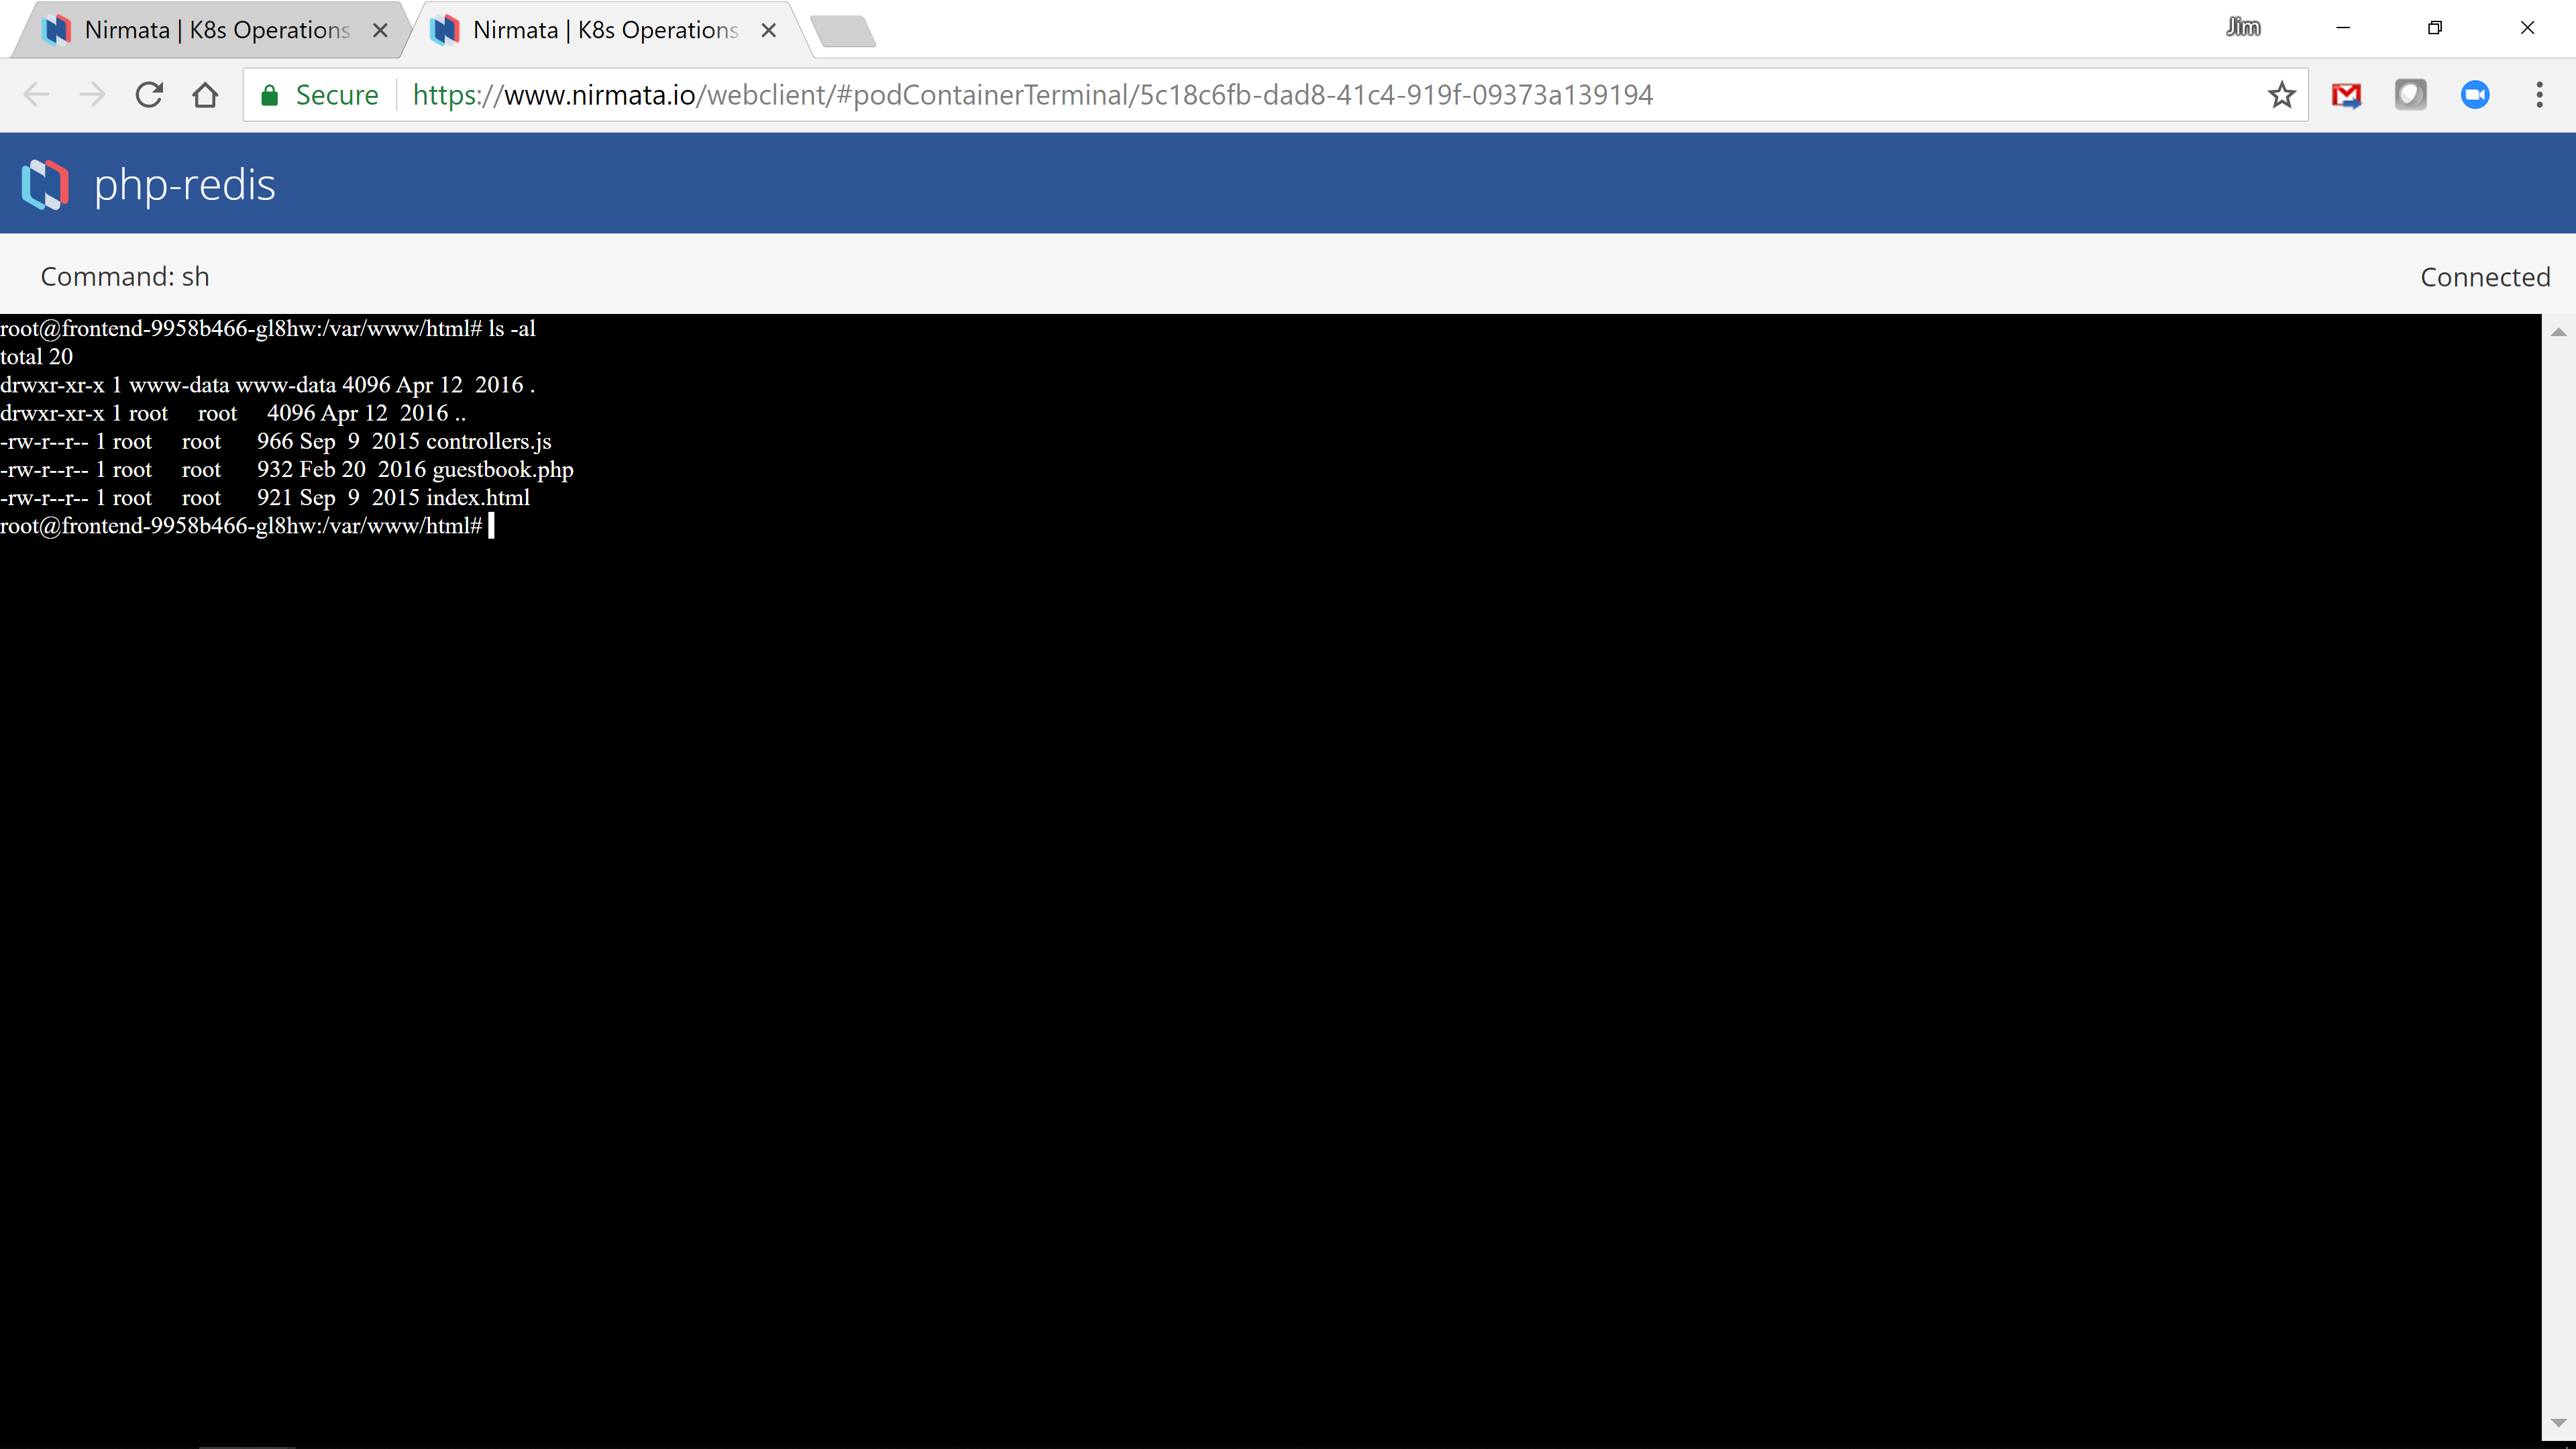
Container Shell
Using Nirmata, you can launch a remote shell into an application container without requiring complex VPN or host access. To launch a Cloud Shell navigate to the “Running Containers” panel and click “Launch Terminal”:
This action opens a new browser window with an embedded shell:
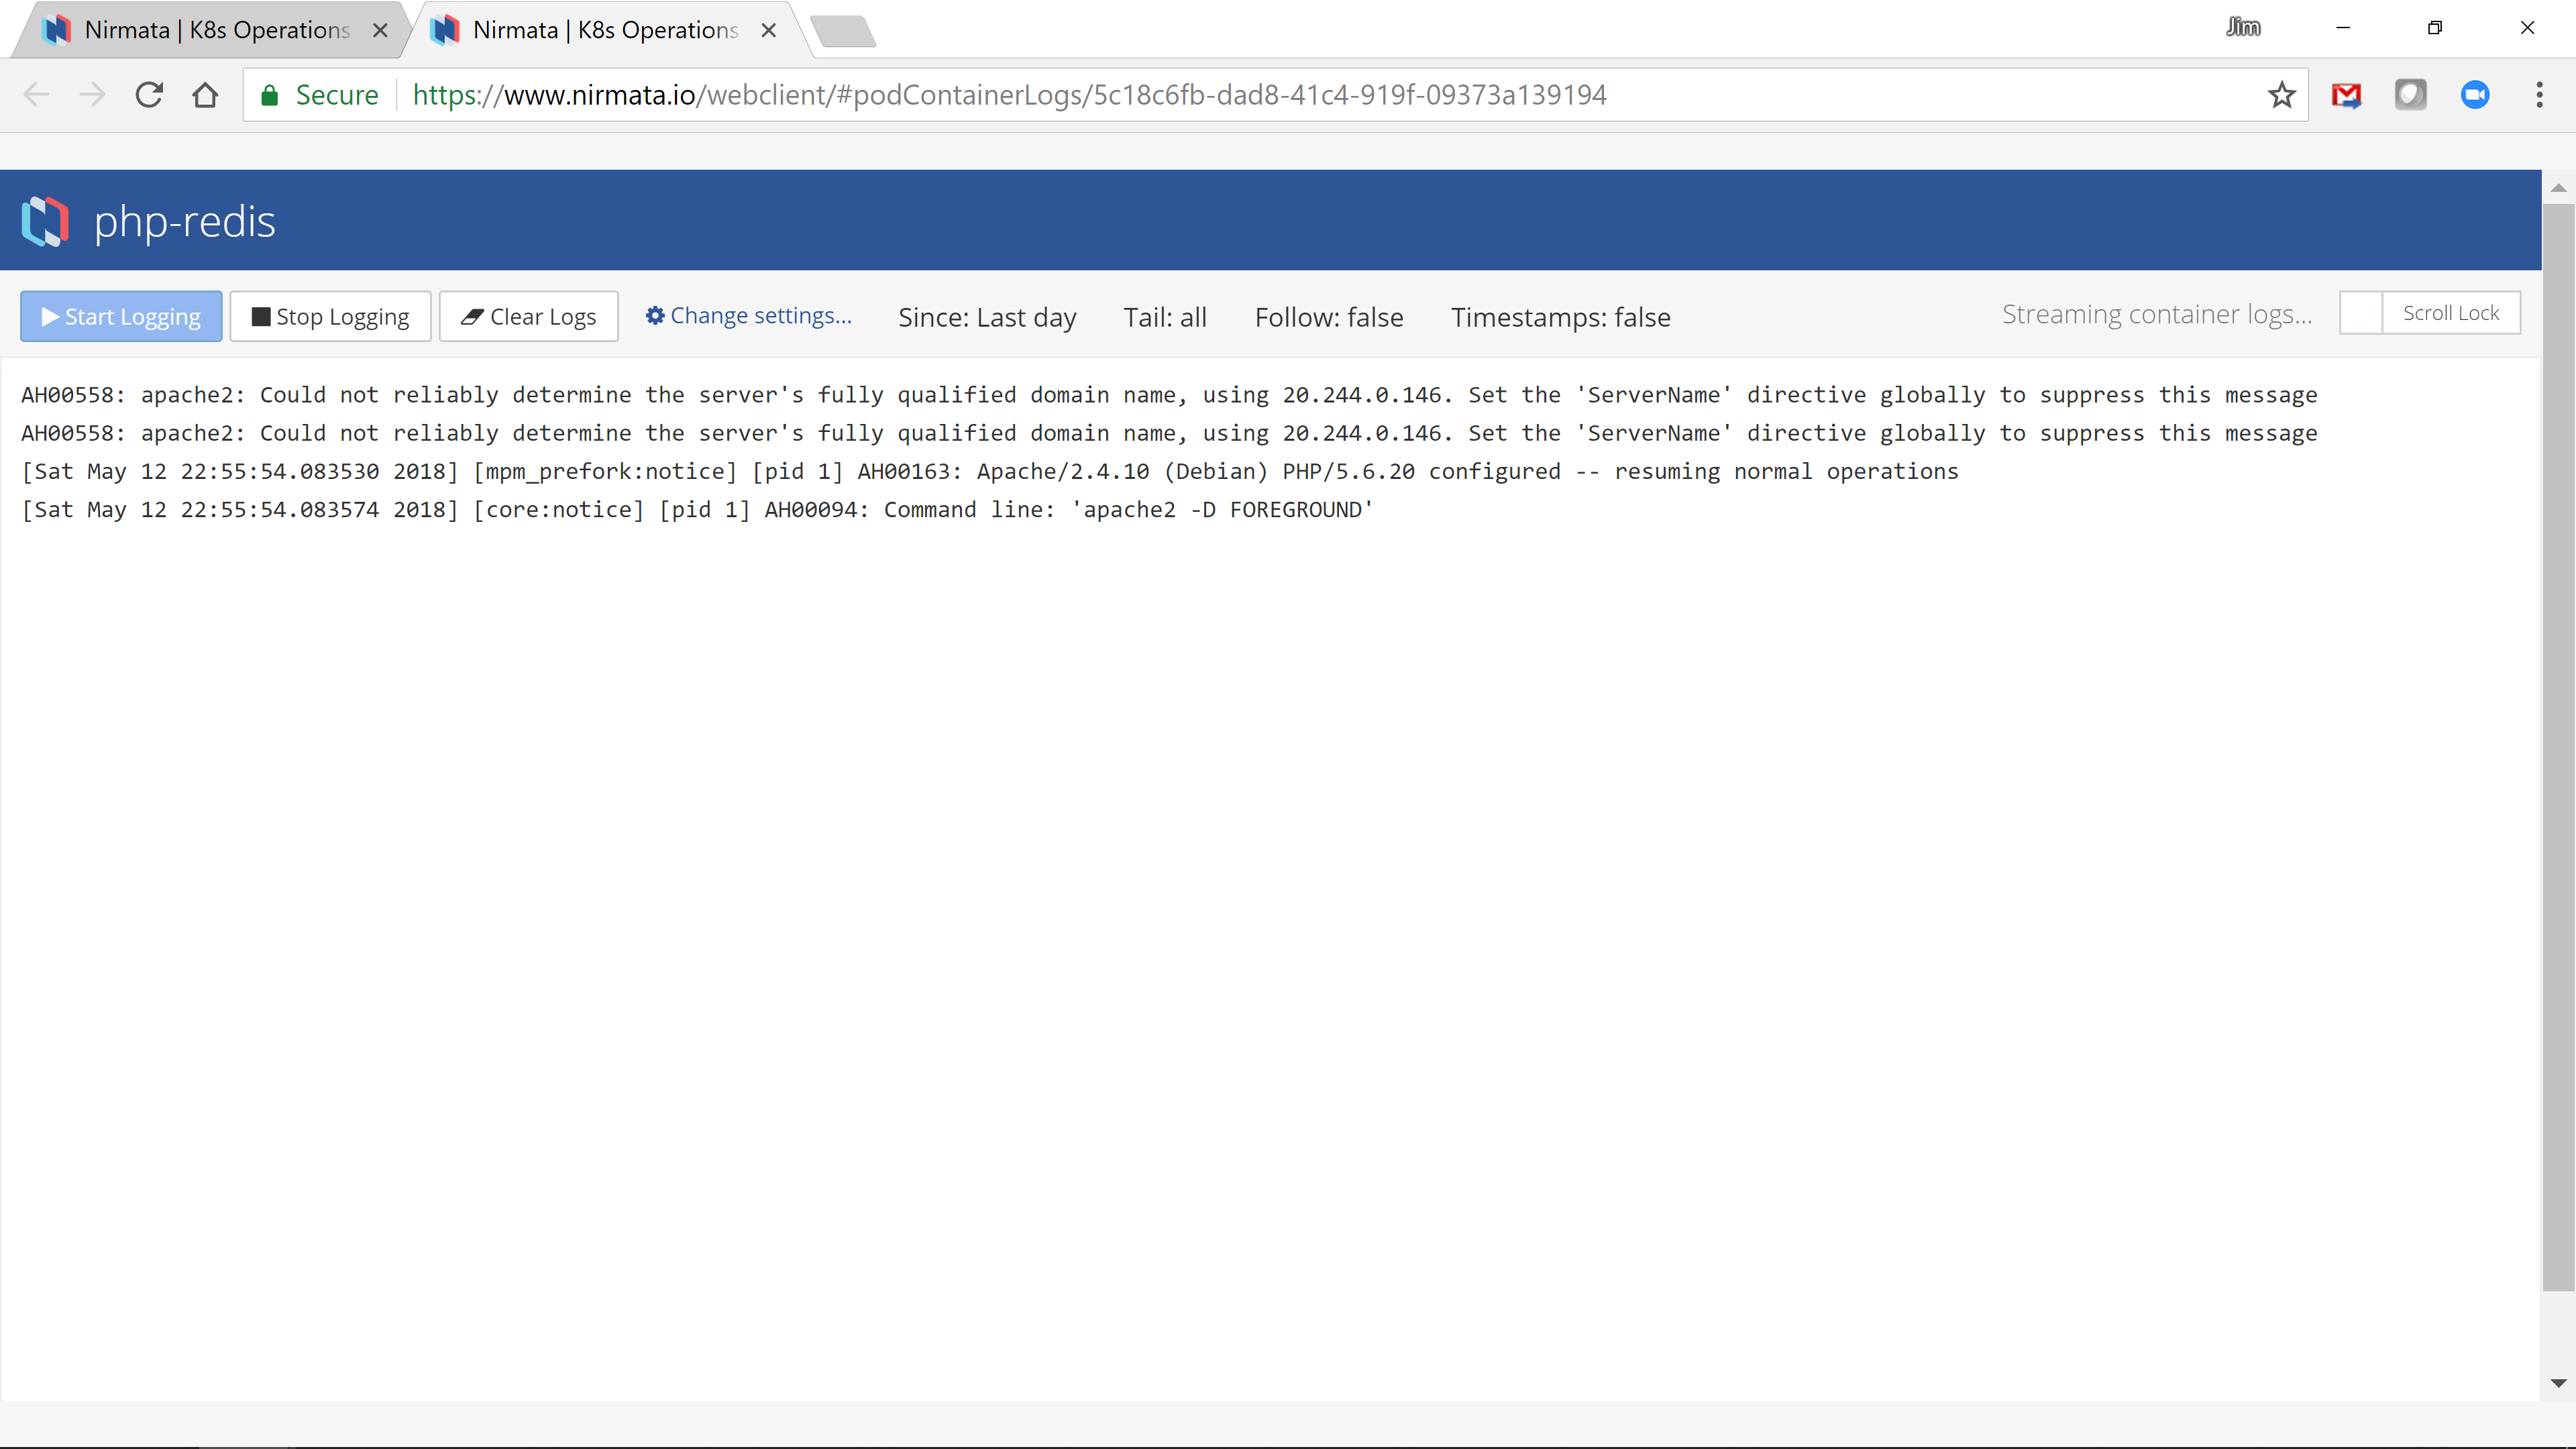
Container Logs
You can also stream a containers log (STDOUT and STDERR) output, by selecting the “View Logs” action: